Docker
Aplicativo de infraestrutura de micro serviços.
- Configuração e Monitoração Docker
- Bash script to log and restart docker container based on cpu usage
- how to get docker stats using shell script
- Docker Stats | Understand how to monitor Docker Metrics with docker stats
- Monitora containers
- Coletar estatísticas Docker com CTOP
- 15 Scripts to Automate Docker Container Management
- Aplicativos/Utilitários Docker
- Instalação Docker
- Repositório Docker Linux Server
- Docker Swarm
Configuração e Monitoração Docker
Processos e monitoração Docker.
Bash script to log and restart docker container based on cpu usage
Link: https://dev.to/tomasggarcia/bash-script-to-log-and-restart-docker-container-cpu-usage-1j2o
I wrote this post to share with you one job experience that I had to live with recently, one problem I had and my temporal solution to this problem.
I'm new in this tech world, I will be grateful if any of you have some improvement recommendations and very pleased if this post it's useful for someone else.
A few mounths ago in my company we discovered that some Docker container was having problems with CPU usage. Out of nowhere the CPU usage of that container was increasing abruptly. So while the dev team was searching for the code error, I implemented a temporary solution. I made one script to log all cpu usage every 5 seconds:
#!/bin/bash
logs=/var/log/process_name.log
container_name=container_name

while :
do
  # Get a variable with the cpu usage for a specific container
  var=`docker stats --no-stream --format "{{.CPUPerc}}" $container_name`
  length=${#var}

  if (( $length==0 )); then
     echo "Container ${container_name} does not exist"
     echo "$(date +'%d-%m-%Y %H:%M') | Container $container_name does not exist" >> $logs
  else
    # CPU usage in number
    percent="${var[@]::-4}"

    echo "Actual cpu usage: ${percent}"

    # Save actual CPU usage in file
    echo "$(date +'%d-%m-%Y %H:%M') | ${percent}" >> $logs
  fi
  sleep 5
After that I created a supervisor config to run this process:
[program:process]
command=/opt/scripts/script.sh
autostart=true
autorestart=true
stderr_logfile=/var/log/process.err.log
stdout_logfile=/var/log/process.err.log
Then I wrote a script to restart the problematic container, based on the logs of the previous script:
#!/bin/bash
container_name=container_name
logs_evaluated_lines=5
logs=/var/log/process_name.log
max_cpu=90

while :
do
    # Lines in file
    num=$(wc -l < $logs)

    counter=0

    # For 'logs_evaluated_lines' lines in logs increase counter if cpu is greater than 100%
    for ((index=$num;index>=$num-$logs_evaluated_lines+1;index--))
    do
    value=$(sed "${index}q;d" $logs)
    percent=$(echo $value | cut -c 20-)
    #echo $percent
    if (( $percent >= max_cpu )); then
    #    echo 'mayor'
        counter=$((counter+1))
    #  else
    #    echo 'menor'
    fi
    done

    echo "$(date +'%d-%m-%Y %H:%M') | Logs up to 100%: ${counter}"
    echo "$(date +'%d-%m-%Y %H:%M') | Logs lines analyzed: ${logs_evaluated_lines}"
    if (( $counter == $logs_evaluated_lines )); then
        echo "$(date +'%d-%m-%Y %H:%M') | CPU Full usage";
        echo "$(date +'%d-%m-%Y %H:%M') | Restarting Container"
        docker restart $container_name
        echo "$(date +'%d-%m-%Y %H:%M') | Container Restarted"
        echo "$(date +'%d-%m-%Y %H:%M') | Container Restarted" >> $logs
    else
        echo "$(date +'%d-%m-%Y %H:%M') | CPU Usage OK"
    fi
    echo "$(date +'%d-%m-%Y %H:%M') |"
    sleep 5
done
This script evaluate 'logs_evaluated_lines' lines in log and restarts the container if the count is upper 'max_cpu' variable
how to get docker stats using shell script
Link: https://iqcode.com/code/typescript/how-to-get-docker-stats-using-shell-script
#!/bin/bash

# This script is used to complete the output of the docker stats command.
# The docker stats command does not compute the total amount of resources (RAM or CPU)

# Get the total amount of RAM, assumes there are at least 1024*1024 KiB, therefore > 1 GiB
HOST_MEM_TOTAL=$(grep MemTotal /proc/meminfo | awk '{print $2/1024/1024}')

# Get the output of the docker stat command. Will be displayed at the end
# Without modifying the special variable IFS the ouput of the docker stats command won't have
# the new lines thus resulting in a failure when using awk to process each line
IFS=;
DOCKER_STATS_CMD=`docker stats --no-stream --format "table {{.MemPerc}}\t{{.CPUPerc}}\t{{.MemUsage}}\t{{.Name}}"`

SUM_RAM=`echo $DOCKER_STATS_CMD | tail -n +2 | sed "s/%//g" | awk '{s+=$1} END {print s}'`
SUM_CPU=`echo $DOCKER_STATS_CMD | tail -n +2 | sed "s/%//g" | awk '{s+=$2} END {print s}'`
SUM_RAM_QUANTITY=`LC_NUMERIC=C printf %.2f $(echo "$SUM_RAM*$HOST_MEM_TOTAL*0.01" | bc)`

# Output the result
echo $DOCKER_STATS_CMD
echo -e "${SUM_RAM}%\t\t\t${SUM_CPU}%\t\t${SUM_RAM_QUANTITY}GiB / ${HOST_MEM_TOTAL}GiB\tTOTAL"Docker Stats | Understand how to monitor Docker Metrics with docker stats
docker stats command returns a live data stream of your running containers.
Docker is a containerization platform that lets you separate your applications from your infrastructure to deliver software quickly. To monitor Docker, it is crucial to gather performance-related metrics from various system elements, such as containers, hosts, and databases.
Methods of monitoring Docker Metrics
There are several ways in which Docker metrics can be monitored. These include;
- Docker stats command
- Pseudo-files in sysfs
- REST API exposed by the Docker daemon
Note that these are in-built features of Docker.
Observability for your containerized application
Observability is critical for modern cloud-native applications. It helps engineering teams have more confidence in their production environment. Troubleshooting performance issues is easier with a robust observability framework in place. SigNoz, an open-source observability tool, can help make your containerized applications observable.
To get started with SigNoz, please visit the documentation.
In this article, we will deep dive into the docker stats command that can be used to monitor Docker metrics right from the terminal.
What is the docker stats command?
The docker stats command is a built-in feature of Docker that displays resource consumption statistics for the container in real-time. By default, it shows CPU and memory utilization for all containers. Stats here refers to “statistics”. You can restrict the statistics by entering the container names or IDs you're interested in monitoring. The docker stats command output includes CPU stats, memory metrics, block I/O, and network IO metrics for all active containers.
A Practical Approach
Running the docker stats command produces an output that looks like the code snippet below. This command shows the stats for all the running Docker containers.
$ docker stats

CONTAINER ID         NAME                  CPU %          MEM USAGE / LIMIT       MEM%            NET I/O              BLOCK I/O           PIDS
56b3f523b0sd         nginx-container       0.35%          2.534MiB / 16.455GiB    0.37%           568B / 0B            134kb / 0B          3
049996113bc8         ubuntu                0.14%          1.437MiB / 16.455GiB    0.10%           3.56kb / 0B          5.12MB / 0B         1
a3f78cb32a8e         hello-world           0.00%          1.228MiB / 16.455GiB    0.06%           65.45kb / 0B         550kb / 0B          0
Understanding the docker stats command output
The docker stats command returns a live snapshot of resource usage by Docker containers. Let’s break down all the stats given by the command.
CPU% stats
CPU is expressed as a percentage (%) of the overall host capacity. One can optimize the resource usage of Docker hosts by being aware of how much CPU the hosts and containers consume. One active/busy container shouldn't slow down other containers by consuming all of the CPU resources. Containers can be optimized based on the amount of CPU they are using.
MEM USAGE / LIMIT Stats
MEM USAGE lists the available memory. It gives a quick overview of the container's memory usage and allocation, providing information about the container's memory statistics, including usage and memory limit. Except when it is defined for a specific container, the memory usage limit corresponds to the host machine's memory limit.
MEM % Stat
MEM % shows the memory percentage that the container is using from its host machine.
Network(NET) I/O Stats
NET I/O shows the volume of information the container's network interface has transmitted(TX) and received (RX). It represents network traffic.
BLOCK I/O Stats
BLOCK I/O helps to identify containers that are writing data and shows the total number of bytes read and written to the container file system. Block I/O stats can give you an idea about issues with data persistence.
PIDS
PIDS is a count of the processes that the container has created or the number of kernel process IDs running inside the corresponding container.
More on the usage of docker stats
Getting stats of a particular container
To get the stats of a particular container, provide the container Id and run the command docker stats <containerID>
$ docker stats 56b3f523b0sd

CONTAINER ID         NAME                  CPU %          MEM USAGE / LIMIT       MEM%            NET I/O              BLOCK I/O           PIDS
56b3f523b0sd         nginx-container       0.35%          2.534MiB / 16.455GiB    0.37%           568B / 0B            134kb / 0B          3
You can also get the stats of multiple containers by name and id if you run
docker stats <containerName> <containerId>
$ docker stats ubuntu 56b3f523b0sd

CONTAINER ID         NAME                  CPU %          MEM USAGE / LIMIT       MEM%            NET I/O              BLOCK I/O           PIDS
049996113bc8         ubuntu                0.14%          1.437MiB / 16.455GiB    0.10%           3.56kb / 0B          5.12MB / 0B         1
56b3f523b0sd         nginx-container       0.35%          2.534MiB / 16.455GiB    0.37%           568B / 0B            134kb / 0B          3
Display options that Docker Provides
These display options allow you to specify how you want the output to be shown.
Docker stats offers the following options for display:
--allwhich shows all containers, whether stopped or running.--formatwhich uses the Go Template syntax to print images out.--no-streamwhich disables streaming stats and only pulls the first result--no-truncwhich instructs Docker not to truncate (shorten) output.
The syntax for this is shown below:
$ docker stats [OPTIONS] [CONTAINER...]
Using docker stats --format
Let’s take a look at the --format option.
Docker format is used to modify the output format of commands that have the --format option. If a command supports this option, it can be used to change the output format of the command to suit our needs since the default command does not display all the fields connected to that object.
By using the Go Template syntax, the formatting option --format presents container output in an easy-to-read way.
For example,
$ docker stats --format "{{.Container}}: {{.CPUPerc}}"

049996113bc8: 0.14%
56b3f523b0sd: 0.35%
This prints out all images with the Container and CPUPerc (CPU Percentage) elements, separated by a colon (:) and it uses a template without headers.
To display all container information in a table format, including name, CPU percentage, and memory consumption, use the following syntax:
$ docker stats --format "table {{.Container}}\t{{.CPUPerc}}\t{{.MemUsage}}"

CONTAINER ID         CPU %          PRIV WORKING SET
56b3f523b0sd         0.35%          2.534MiB / 16.455GiB
049996113bc8         0.14%          1.437MiB / 16.455GiB
a3f78cb32a8e         0.00%          1.228MiB / 16.455GiB
Here is the list of applicable placeholders to use with the Go template syntax:
| Placeholder | Description |
|---|---|
| .container | Container name or ID (user input) |
| .Name | Container name |
| .ID | Container ID |
| .CPUPerc | CPU percentage |
| .MemUsage | Memory usage |
| .NetIO | Network IO |
| .BlockIO | Block IO |
| .MemPerc | Memory percentage (Not available on Windows) |
| .PIDs | Number of PIDs (Not available on Windows) |
Final Thoughts
In this article, we discussed ways to monitor resource usage metrics in Docker focused on the docker stats command. Other ways of using The Docker stats, Pseudo-files in sysfs, and REST API exposed by the Docker daemon are native ways of monitoring resource utilization metrics.
Docker container monitoring is critical for running containerized applications. For a robust monitoring and observability setup, you need to use a tool that visualizes the metrics important for container monitoring and also lets you set alerts on critical metrics. SigNoz is an open-source observability tool that can help you do that.
It uses OpenTelemetry to collect metrics from your containers for monitoring. OpenTelemetry is becoming the world standard for instrumentation of cloud-native applications, and it is backed by CNCF foundation, the same foundation under which Kubernetes graduated.
If you want to set up a robust observability framework for your containerized application, you can use SigNoz. You can create unified views to monitor your Docker containers effectively.
It is easy to get started with SigNoz. It can be installed on macOS or Linux computers in just three steps by using a simple installation script.
The install script automatically installs Docker Engine on Linux. However, you must manually install Docker Engine on macOS before running the install script.
git clone -b main https://github.com/SigNoz/signoz.git
cd signoz/deploy/
./install.sh
Monitora containers
Link: https://gist.github.com/haukurk/a6e0751a8b8746265f8b2c55d9476230
Coletar estatísticas Docker com CTOP
Link: https://github.com/bcicen/ctop
git clone https://github.com/bcicen/ctop.git
![]()


Top-like interface for container metrics
ctop provides a concise and condensed overview of real-time metrics for multiple containers:

as well as a single container view for inspecting a specific container.
ctop comes with built-in support for Docker and runC; connectors for other container and cluster systems are planned for future releases.
Install
Fetch the latest release for your platform:
Debian/Ubuntu
Maintained by a third party
sudo apt-get install ca-certificates curl gnupg lsb-release
curl -fsSL https://azlux.fr/repo.gpg.key | sudo gpg --dearmor -o /usr/share/keyrings/azlux-archive-keyring.gpg
echo \
  "deb [arch=$(dpkg --print-architecture) signed-by=/usr/share/keyrings/azlux-archive-keyring.gpg] http://packages.azlux.fr/debian \
  $(lsb_release -cs) main" | sudo tee /etc/apt/sources.list.d/azlux.list >/dev/null
sudo apt-get update
sudo apt-get install docker-ctop
Arch
sudo pacman -S ctop
ctop is also available for Arch in the AUR
Linux (Generic)
sudo wget https://github.com/bcicen/ctop/releases/download/v0.7.7/ctop-0.7.7-linux-amd64 -O /usr/local/bin/ctop
sudo chmod +x /usr/local/bin/ctop
OS X
brew install ctop
or
sudo port install ctop
or
sudo curl -Lo /usr/local/bin/ctop https://github.com/bcicen/ctop/releases/download/v0.7.7/ctop-0.7.7-darwin-amd64
sudo chmod +x /usr/local/bin/ctop
Windows
ctop is available in scoop:
scoop install ctop
Docker
docker run --rm -ti \
  --name=ctop \
  --volume /var/run/docker.sock:/var/run/docker.sock:ro \
  quay.io/vektorlab/ctop:latest
Building
Build steps can be found here.
Usage
ctop requires no arguments and uses Docker host variables by default. See connectors for further configuration options.
Config file
While running, use S to save the current filters, sort field, and other options to a default config path (~/.config/ctop/config on XDG systems, else ~/.ctop).
Config file values will be loaded and applied the next time ctop is started.
Options
| Option | Description |
|---|---|
-a |
show active containers only |
-f <string> |
set an initial filter string |
-h |
display help dialog |
-i |
invert default colors |
-r |
reverse container sort order |
-s |
select initial container sort field |
-v |
output version information and exit |
Keybindings
| Key | Action |
|---|---|
| <ENTER> | Open container menu |
| a | Toggle display of all (running and non-running) containers |
| f | Filter displayed containers (esc to clear when open) |
| H | Toggle ctop header |
| h | Open help dialog |
| s | Select container sort field |
| r | Reverse container sort order |
| o | Open single view |
| l | View container logs (t to toggle timestamp when open) |
| e | Exec Shell |
| c | Configure columns |
| S | Save current configuration to file |
| q | Quit ctop |
Alternatives
See Awesome Docker list for similar tools to work with Docker.
15 Scripts to Automate Docker Container Management
Link: https://blog.devops.dev/15-scripts-to-automate-docker-container-management-4bab4c3faf73
Each example comes with functioning code and detailed explanations.
1. Automatically Start All Containers
Sometimes after a system reboot or maintenance, you may want to start all stopped containers at once.
#!/bin/bash
# Start all stopped containers
docker start $(docker ps -aq)
- ‘docker ps -aq’ lists all container IDs (stopped and running).
- ‘docker start’ starts the containers by passing the IDs as arguments.
2. Stop All Running Containers
Quickly stop all currently running containers.
#!/bin/bash
# Stop all running containers
docker stop $(docker ps -q)
- ‘docker ps -q’ lists IDs of only running containers.
- ‘docker stop’ stops these containers.
3. Remove Stopped Containers
Free up space by cleaning up stopped containers.
#!/bin/bash
# Remove all stopped containers
docker rm $(docker ps -aq -f "status=exited")
- `docker ps -aq -f "status=exited"` filters stopped containers.
- ‘docker rm’ removes them.
4. Remove Dangling Images
Clear unused Docker images to save disk space.
#!/bin/bash
# Remove dangling images
docker rmi $(docker images -q -f "dangling=true")
- `docker images -q -f "dangling=true"` lists image IDs with no tags (dangling).
- ‘docker rmi’ removes these images.
5. Backup a Container’s Data
Export the filesystem of a running container to a tar file.
#!/bin/bash
# Backup a container's data
CONTAINER_ID=$1
BACKUP_FILE="${CONTAINER_ID}_backup_$(date +%F).tar"
docker export $CONTAINER_ID > $BACKUP_FILE
echo "Backup saved to $BACKUP_FILE"
- ‘docker export’ exports the filesystem of the container.
- Pass the container ID as an argument to the script.
6. Restore a Container from Backup
Recreate a container from a tar backup file.
#!/bin/bash
# Restore a container from a tar backup
BACKUP_FILE=$1
docker import $BACKUP_FILE restored_container:latest
echo "Container restored as 'restored_container:latest'"
- ‘docker import’ creates a new image from the tar file.
- The image can be used to start new containers.
7. Monitor Container Resource Usage
Display real-time stats for all running containers.
#!/bin/bash
# Monitor resource usage of all running containers
docker stats --all
- ‘docker stats’ shows real-time CPU, memory, and network stats.
- ‘--all’ includes stopped containers.
8. Restart a Container Automatically
Ensure critical containers restart after failure.
#!/bin/bash
# Restart a container with restart policy
CONTAINER_NAME=$1
docker update --restart always $CONTAINER_NAME
echo "$CONTAINER_NAME will now restart automatically on failure."
- ‘docker update --restart always’ configures the restart policy.
- Pass the container name as an argument.
9. Run a Container and Clean Up After Exit
Automatically remove a container after it stops.
#!/bin/bash
# Run a container and clean up
IMAGE_NAME=$1
docker run --rm $IMAGE_NAME
- ‘--rm’ removes the container when it stops.
- Useful for one-off tasks.
10. Check Logs of All Containers
Combine logs from multiple containers into one output.
#!/bin/bash
# Display logs of all containers
docker ps -q | xargs -I {} docker logs {}
- ‘docker ps -q’ lists running container IDs.
- ‘xargs’ passes these IDs to ‘docker logs’.
11. Auto-Prune Unused Resources
Schedule automated cleanup of unused Docker resources.
#!/bin/bash
# Prune unused resources
docker system prune -f --volumes
- ‘docker system prune’ removes unused containers, networks, and images.
- ‘--volumes’ also deletes unused volumes.
12. Update Running Containers
Recreate containers with the latest image version.
#!/bin/bash
# Update a running container
CONTAINER_NAME=$1
IMAGE_NAME=$(docker inspect --format='{{.Config.Image}}' $CONTAINER_NAME)
docker pull $IMAGE_NAME
docker stop $CONTAINER_NAME
docker rm $CONTAINER_NAME
docker run -d --name $CONTAINER_NAME $IMAGE_NAME
- ‘docker inspect’ fetches the image name of a container.
- The script pulls the latest image and recreates the container.
13. Copy Files from a Container
Extract files or directories from a container to the host.
#!/bin/bash
# Copy files from a container
CONTAINER_ID=$1
SOURCE_PATH=$2
DEST_PATH=$3
docker cp $CONTAINER_ID:$SOURCE_PATH $DEST_PATH
echo "Copied $SOURCE_PATH from $CONTAINER_ID to $DEST_PATH"
- ‘docker cp’ copies files between the container and the host.
- Pass container ID, source path, and destination path as arguments.
14. Restart All Containers
Restart all running containers quickly.
#!/bin/bash
# Restart all containers
docker restart $(docker ps -q)
- ‘docker restart’ restarts containers by their IDs.
15. List All Exposed Ports
Check the exposed ports of running containers.
#!/bin/bash
# List all exposed ports
docker ps --format '{{.ID}}: {{.Ports}}'
- ‘docker ps --format’ customizes the output to show container IDs and ports.
Feel free to tweak, experiment and customize them to your needs.
Aplicativos/Utilitários Docker
Awesome Docker
Link: https://github.com/veggiemonk/awesome-docker/blob/master/README.md#terminal
A curated list of Docker resources and projects
If you would like to contribute, please read CONTRIBUTING.md first. It contains a lot of tips and guidelines to help keep things organized. Just click README.md to submit a pull request. If this list is not complete, you can contribute to make it so. Here is a great video tutorial to learn how to contribute on Github.
You can see the updates on TWITTER
Please, help organize these resources so that they are easy to find and understand for newcomers. See how to Contribute for tips!
If you see a link here that is not (any longer) a good fit, you can fix it by submitting a pull request to improve this file. Thank you!
The creators and maintainers of this list do not receive any form of payment to accept a change made by any contributor. This page is not an official Docker product in any way. It is a list of links to projects and is maintained by volunteers. Everybody is welcome to contribute. The goal of this repo is to index open-source projects, not to advertise for profit.
All the links are monitored and tested with a home baked Node.js script
Contents
- Legend
- What is Docker
- Where to start
- Where to start (Windows)
- Projects
- Useful Resources
- Communities and Meetups
Legend
- Abandoned 💀
- Beta 🚧
- Monetized 💲
What is Docker
Docker is an open platform for developers and sysadmins to build, ship, and run distributed applications. Consisting of Docker Engine, a portable, lightweight runtime and packaging tool, and Docker Hub, a cloud service for sharing applications and automating workflows, Docker enables apps to be quickly assembled from components and eliminates the friction between development, QA, and production environments. As a result, IT can ship faster and run the same app, unchanged, on laptops, data center VMs, and any cloud.
Source: What is Docker
Where to start
- Benefits of using Docker for development and delivery, with a practical roadmap for adoption.
- Bootstrapping Microservices by Ashley Davis - A practical and project-based guide to building applications with microservices, starts by building a Docker image for a single microservice and publishing it to a private container registry, finishes by deploying a complete microservices application to a production Kubernetes cluster.
- Docker Curriculum: A comprehensive tutorial for getting started with Docker. Teaches how to use Docker and deploy dockerized apps on AWS with Elastic Beanstalk and Elastic Container Service.
- Docker Documentation: the official documentation.
- Docker for beginners: A tutorial for beginners who need to learn the basics of Docker—from "Hello world!" to basic interactions with containers, with simple explanations of the underlying concepts.
- Docker for novices An introduction to Docker for developers and testers who have never used it. (Video 1h40, recorded linux.conf.au 2019 — Christchurch, New Zealand) by Alex Clews.
- Docker katas A series of labs that will take you from "Hello Docker" to deploying a containerized web application to a server.
- Docker Latest Tutorial — This is a series of latest docker tutorial, where you can learn what is docker, docker lifecycle, how to run Nginx Web Server in Docker?, how to run mysql on docker container, how to use Python on doceker and many other important topics.
- Docker simplified in 55 seconds: An animated high-level introduction to Docker. Think of it as a visual tl;dr that makes it easier to dive into more complex learning materials.
- Docker Training 💲
- Docker Tutorial for Beginners (Updated 2019 version) — In this Docker tutorial, you'll learn all the basics and learn how you can containerize Node.js and Go applications. Even if you aren't familiar with these languages it should be easy for you to follow this tutorial and use any other language.
- Learn Docker: step-by-step tutorial and more resources (video, articles, cheat sheets) by @dwyl
- Learn Docker (Visually) - A beginner-focused high-level overview of all the major components of Docker and how they fit together. Lots of high-quality images, examples, and resources.
- Play With Docker: PWD is a great way to get started with Docker from beginner to advanced users. Docker runs directly in your browser.
- Practical Guide about Docker Commands in Spanish This spanish guide contains the use of basic docker commands with real life examples.
- Practical Introduction to Container Terminology The landscape for container technologies is larger than just docker. Without a good handle on the terminology, It can be difficult to grasp the key differences between docker and (pick your favorites, CRI-O, rkt, lxc/lxd) or understand what the Open Container Initiative is doing to standardize container technology.
- Setting Python Development Environment with VScode and Docker: A step-by-step tutorial for setting up a dockerized Python development environment with VScode, Docker, and the Dev Container extension.
- The Docker Handbook An open-source book that teaches you the fundamentals, best practices and some intermediate Docker functionalities. The book is hosted on fhsinchy/the-docker-handbook and the projects are hosted on fhsinchy/docker-handbook-projects repository.
Cheatsheets by
- @eon01
- @dimonomid (PDF)
- @JensPiegsa
- @wsargent (Most popular)
Where to start (Windows)
- A Comparative Study of Docker Engine on Windows Server vs Linux Platform Comparing the feature sets and implementations of Docker on Windows and Linux
- Docker on Windows behind a firewall by @kaitoedter
- Docker Reference Architecture: Modernizing Traditional .NET Framework Applications - You will learn to identify the types of .NET Framework applications that are good candidates for containerization, the "lift-and-shift" approach to containerization.
- Docker with Microsoft SQL 2016 + ASP.NET Demonstration running ASP.NET and SQL Server workloads in Docker
- Exploring ASP.NET Core with Docker in both Linux and Windows Containers Running ASP.NET Core apps in Linux and Windows containers, using Docker for Windows
- Running a Legacy ASP.NET App in a Windows Container Steps for Dockerizing a legacy ASP.NET app and running as a Windows container
- Windows Containers and Docker: The 101 🎥 - A 20-minute overview, using Docker to run PowerShell, ASP.NET Core and ASP.NET apps
- Windows Containers Quick Start Overview of Windows containers, drilling down to Quick Starts for Windows 10 and Windows Server 2016
Projects
- Moby = open source development
- Docker CE = free product release based on Moby
- Docker EE = commercial product release based on Docker CE.
Docker EE is on the same code base as Docker CE, so also built from Moby, with commercial components added, such as "docker data center / universal control plane"
- Moby
- Docker Images
- Docker Compose (Define and run multi-container applications with Docker)
- Docker Machine (Machine management for a container-centric world)
- Docker Registry (The Docker toolset to pack, ship, store, and deliver content)
- Docker Swarm (Swarm: a Docker-native clustering system)
Container Operations
Container Composition
- bocker (2) 💀 - Write Dockerfile completely in Bash. Extensible and simple. --> Reusable by @icy
- bocker (1) 💀 - Docker implemented in 100 lines of bash by p8952
- box 💀 - Build Dockerfile images with a mruby DSL, includes flattening and layer manipulation
- Capitan - Composable docker orchestration with added scripting support by @byrnedo.
- compose_plantuml 💀 - Generate Plantuml graphs from docker-compose files by @funkwerk
- Composerize - Convert docker run commands into docker-compose files
- crowdr - Tool for managing multiple Docker containers (
docker-composealternative) by @polonskiy - ctk 🚧 - Visual composer for container based workloads. By @corpulent
- docker-compose-graphviz 💀 - Turn a docker-compose.yml files into Graphviz .dot files by @abesto
- docker-config-update - Utility to update docker configs and secrets for deploying in a compose file by @sudo-bmitch
- draw-compose 💀 - Utility to draw a schema of a docker compose by @Alexis-benoist
- elsy - An opinionated, multi-language, build tool based on Docker and Docker Compose
- habitus - A Build Flow Tool for Docker by @cloud66
- kompose - Go from Docker Compose to Kubernetes
- Maestro 💀 - Maestro provides the ability to easily launch, orchestrate and manage multiple Docker containers as single unit by @tascanini
- percheron 💀 - Organise your Docker containers with muscle and intelligence by @ashmckenzie
- plash - A container run and build engine - runs inside docker.
- podman-compose - a script to run docker-compose.yml using podman by @containers
- rocker-compose 💀 - Docker composition tool with idempotency features for deploying apps composed of multiple containers. By@grammarly.
- rocker 💀 - Extended Dockerfile builder. Supports multiple FROMs, MOUNTS, templates, etc. by @grammarly.
- Smalte – Dynamically configure applications that require static configuration in docker container. By @roquie
- Stacker 💀 - Docker Compose Templates. Stacker provides an abstraction layer over Docker Compose and a better DX (developer experience).
- Stitchocker - A lightweight and fast command line utility for conveniently grouping your docker-compose multiple container services. By @alexaandrov
- Zodiac 💀 - A lightweight tool for easy deployment and rollback of dockerized applications. By @CenturyLinkLabs
Deployment and Infrastructure
- awesome-stacks - Deploy 80+ open-source web apps with one Docker command
- blackfish - a CoreOS VM to build swarm clusters for Dev & Production by @blackfish
- BosnD - BosnD, the boatswain daemon - A dynamic configuration file writer & service reloader for dynamically changing container environments.
- Centurion - Centurion is a mass deployment tool for Docker fleets. It takes containers from a Docker registry and runs them on a fleet of hosts with the correct environment variables, host volume mappings, and port mappings. By @newrelic
- Clocker - Clocker creates and manages a Docker cloud infrastructure. Clocker supports single-click deployments and runtime management of multi-node applications that run as containers distributed across multiple hosts, on both Docker and Marathon. It leverages Calico and Weave for networking and Brooklyn for application blueprints. By @brooklyncentral
- Conduit - Experimental deployment system for Docker by @ehazlett
- depcon - Depcon is written in Go and allows you to easily deploy Docker containers to Apache Mesos/Marathon, Amazon ECS and Kubernetes. By @ContainX
- deploy 💀 - Git and Docker deployment tool. A middle ground between simple Docker composition tools and full blown cluster orchestration by @ttiny
- dockit 💀 - Do docker actions and Deploy gluster containers! By @humblec
- gitkube - Gitkube is a tool for building and deploying docker images on Kubernetes using
git push. By @Hasura. - Grafeas - A common API for metadata about containers, from image and build details to security vulnerabilities. By grafeas
- Longshoreman 💀 - Longshoreman automates application deployment using Docker. Just create a Docker repository (or use a service), configure the cluster using AWS or Digital Ocean (or whatever you like) and deploy applications using a Heroku-like CLI tool. By longshoreman
- SwarmManagement - Swarm Management is a python application, installed with pip. The application makes it easy to manage a Docker Swarm by configuring a single yaml file describing which stacks to deploy, and which networks, configs or secrets to create.
- werf - werf is a CI/CD tool for building Docker images efficiently and deploying them to Kubernetes using GitOps by @flant
Monitoring
- Autoheal - Monitor and restart unhealthy docker containers automatically.
- Axibase Collector - Axibase Collector streams performance counters, configuration changes and lifecycle events from the Docker engine(s) into Axibase Time Series Database for roll-up dashboards and integration with upstream monitoring systems.
- cAdvisor - Analyzes resource usage and performance characteristics of running containers. Created by @Google
- Docker-Alertd - Monitor and send alerts based on docker container resource usage/statistics
- Docker-Flow-Monitor - Reconfigures Prometheus when a new service is updated or deployed automatically by @docker-flow
- Dockerana 💀 - packaged version of Graphite and Grafana, specifically targeted at metrics from Docker.
- DockProc - I/O monitoring for containers on processlevel.
- dockprom - Docker hosts and containers monitoring with Prometheus, Grafana, cAdvisor, NodeExporter and AlertManager by @stefanprodan
- Doku - Doku is a simple web-based application that allows you to monitor Docker disk usage. @amerkurev
- Dozzle - Monitor container logs in real-time with a browser or mobile device. @amir20
- Dynatrace 💲 - Monitor containerized applications without installing agents or modifying your Run commands
- Glances - A cross-platform curses-based system monitoring tool written in Python by @nicolargo
- Grafana Docker Dashboard Template - A template for your Docker, Grafana and Prometheus stack @vegasbrianc
- HertzBeat - An open-source real-time monitoring system with custom-monitor and agentless.
- InfluxDB, cAdvisor, Grafana - InfluxDB Time series DB in combination with Grafana and cAdvisor by @vegasbrianc
- LogJam - Logjam is a log forwarder designed to listen on a local port, receive log entries over UDP, and forward these messages on to a log collection server (such as logstash) by @gocardless
- Logspout - Log routing for Docker container logs by @gliderlabs
- monit-docker - Monitor docker containers resources usage or status and execute docker commands or inside containers. [@decryptus][decryptus]
- NexClipper - NexClipper is the container monitoring and performance management solution specialized in Docker, Apache Mesos, Marathon, DC/OS, Mesosphere, Kubernetes by @Nexclipper
- Out-of-the-box Host/Container Monitoring/Logging/Alerting Stack - Docker host and container monitoring, logging and alerting out of the box using cAdvisor, Prometheus, Grafana for monitoring, Elasticsearch, Kibana and Logstash for logging and elastalert and Alertmanager for alerting. Set up in 5 Minutes. Secure mode for production use with built-in Automated Nginx Reverse Proxy (jwilder's).
- Sidekick 💲 - Open source live application debugger like Chrome DevTools for your backend. Collect traces and generate logs on-demand without stopping & redeploying your applications.
- SuperVisor CPM Frontend Service and Driver Service 🚧 - A simple and accessible FOSS container performance monitoring service written in Python by @t0xic0der
- SwarmAlert - Monitors a Docker Swarm and sends Pushover alerts when it finds a container with no healthy service task running.
- Zabbix Docker module - Zabbix module that provides discovery of running containers, CPU/memory/blk IO/net container metrics. Systemd Docker and LXC execution driver is also supported. It's a dynamically linked shared object library, so its performance is (~10x) better, than any script solution.
- Zabbix Docker - Monitor containers automatically using zabbix LLD feature.
Networking
- Calico - Calico is a pure layer 3 virtual network that allows containers over multiple docker-hosts to talk to each other.
- Flannel - Flannel is a virtual network that gives a subnet to each host for use with container runtimes. By @coreos
- Freeflow - High performance container overlay networks on Linux. Enabling RDMA (on both InfiniBand and RoCE) and accelerating TCP to bare metal performance. By @Microsoft
- netshoot - The netshoot container has a powerful set of networking tools to help troubleshoot Docker networking issues by @nicolaka
- Pipework - Software-Defined Networking for Linux Containers, Pipework works with "plain" LXC containers, and with the awesome Docker. By @jpetazzo
- Weave (The Docker network) - Weave creates a virtual network that connects Docker containers deployed across multiple hosts.
Orchestration
- Ansible Linux Docker - Run Ansible from a Linux container. By @Peco602
- athena - An automation platform with a plugin architecture that allows you to easily create and share services.
- blimp 💀 - Uses Docker Machine to easily move a container from one Docker host to another, show containers running against all of your hosts, replicate a container across multiple hosts and more by @defermat and @schvin
- CloudSlang - CloudSlang is a workflow engine to create Docker process automation
- clusterdock - Docker container orchestration to enable the testing of long-running cluster deployments
- Crane - Control plane based on docker built-in swarm @Dataman-Cloud
- Docker Flow Swarm Listener - Docker Flow Swarm Listener project is to listen to Docker Swarm events and send requests when a change occurs. By @docker-flow
- docker rollout - Zero downtime deployment for Docker Compose services by @Wowu
- gantryd 💀 - A framework for easy management of docker-based components across machines by @DevTable
- Haven - Haven is a simplified container management platform that integrates container, application, cluster, image, and registry managements. By @codeabovelab
- Helios 💀 - A simple platform for deploying and managing containers across an entire fleet of servers by @spotify
- Kontena 💀 - The developer friendly container and micro services platform. Works on any cloud, easy to setup, simple to use.
- Kubernetes - Open source orchestration system for Docker containers by Google
- ManageIQ - Discover, optimize and control your hybrid IT. By ManageIQ
- Mantl - Mantl is a modern platform for rapidly deploying globally distributed services
- Marathon - Marathon is a private PaaS built on Mesos. It automatically handles hardware or software failures and ensures that an app is "always on"
- Mesos - Resource/Job scheduler for containers, VM's and physical hosts @apache
- Nebula - A Docker orchestration tool designed to manage massive scale distributed clusters.
- Nomad - Easily deploy applications at any scale. A Distributed, Highly Available, Datacenter-Aware Scheduler by @hashicorp
- Panamax 💀 - An open-source project that makes deploying complex containerized apps as easy as Drag-and-Drop by @CenturyLinkLabs.
- Rancher - An open source project that provides a complete platform for operating Docker in production by @rancher.
- RedHerd Framework - RedHerd is a collaborative and serverless framework for orchestrating a geographically distributed group of assets capable of simulating complex offensive cyberspace operations. By @RedHerdProject.
- Swarm-cronjob - Create jobs on a time-based schedule on Swarm by @crazy-max
PaaS
- Atlantis 💀 - Atlantis is an Open Source PaaS for HTTP applications built on Docker and written in Go
- caprover - [previously known as CaptainDuckDuck] Automated Scalable Webserver Package (automated Docker+nginx) - Heroku on Steroids
- Convox Rack - Convox Rack is open source PaaS built on top of expert infrastructure automation and devops best practices.
- Dcw - Docker-compose SSH wrapper: a very poor man PaaS, exposing the docker-compose and custom-container commands defined in container labels.
- Dokku - Docker powered mini-Heroku that helps you build and manage the lifecycle of applications (originally by @progrium)
- Empire - A PaaS built on top of Amazon EC2 Container Service (ECS)
- Exoframe - A self-hosted tool that allows simple one-command deployments using Docker
- Flynn 💀 - A next generation open source platform as a service
- Hephy Workflow - Open source PaaS for Kubernetes that adds a developer-friendly layer to any Kubernetes cluster, making it easy to deploy and manage applications. Fork of Deis Workflow
- Krane - Toolset for managing container workloads on remote servers
- Nanobox 💲 - An application development platform that creates local environments that can then be deployed and scaled in the cloud.
- OpenShift - An open source PaaS built on Kubernetes and optimized for Dockerized app development and deployment by Red Hat
- Tsuru - Tsuru is an extensible and open source Platform as a Service software
Reverse Proxy
- bunkerized-nginx - Web app hosting and reverse proxy secure by default. By @bunkerity
- caddy-docker-proxy - Caddy-based reverse proxy, configured with service or container labels. By @lucaslorentz
- Docker Dnsmasq Updater - Update a remote dnsmasq server with Docker container hostnames.
- docker-flow-proxy - Reconfigures proxy every time a new service is deployed, or when a service is scaled. By @docker-flow
- docker-proxy 💀 - Transparent proxy for docker containers, run in a docker container. By @silarsis
- fabio - A fast, modern, zero-conf load balancing HTTP(S) router for deploying microservices managed by consul. By @magiconair (Frank Schroeder)
- h2o-proxy 💀 - Automated H2O reverse proxy for Docker containers. An alternative to jwilder/nginx-proxy by @zchee
- Let's Encrypt Nginx-proxy Companion - A lightweight companion container for the nginx-proxy. It allow the creation/renewal of Let's Encrypt certificates automatically. By @JrCs
- muguet 💀 - DNS Server & Reverse proxy for Docker environments. By @mattallty
- Nginx Proxy Manager - A beautiful web interface for proxying web based services with SSL. By @jc21
- nginx-proxy - Automated nginx proxy for Docker containers using docker-gen by @jwilder
- Swarm Ingress Router 💀 - Route DNS names to Swarm services based on labels. By @tpbowden
- Swarm Router - A «zero config» service name based router for docker swarm mode with a fresh and more secure approach. By @flavioaiello
- Træfɪk - Automated reverse proxy and load-balancer for Docker, Mesos, Consul, Etcd... By @EmileVauge
Runtime
- aind - AinD launches Android apps in Docker, by nesting Anbox containers inside Docker by @aind-containers
- cri-o - Open Container Initiative-based implementation of Kubernetes Container Runtime Interface by cri-o
- lxc - LXC - Linux Containers
- podman - libpod is a library used to create container pods. Home of Podman by @containers
- rlxc - LXC binary written in Rust by @brauner
- runtime-tools - oci-runtime-tool is a collection of tools for working with the OCI runtime specification by @opencontainers
Security
- Anchor Engine - Analyze images for CVE vulnerabilities and against custom security policies by @Anchor
- Aqua Security 💲 - Securing container-based applications from Dev to Production on any platform
- bane - AppArmor profile generator for Docker containers by @genuinetools
- CetusGuard - CetusGuard is a tool that protects the Docker daemon socket by filtering calls to its API endpoints
- CIS Docker Benchmark - This InSpec compliance profile implement the CIS Docker 1.12.0 Benchmark in an automated way to provide security best-practice tests around Docker daemon and containers in a production environment. By @dev-sec
- Checkov - Static analysis for infrastructure as code manifests (Terraform, Kubernetes, Cloudformation, Helm, Dockerfile, Kustomize) find security misconfiguration and fix them. By @bridgecrew
- Clair - Clair is an open source project for the static analysis of vulnerabilities in appc and docker containers. By @coreos
- Dagda - Dagda is a tool to perform static analysis of known vulnerabilities, trojans, viruses, malware & other malicious threats in docker images/containers and to monitor the docker daemon and running docker containers for detecting anomalous activities. By @eliasgranderubio
- Deepfence Enterprise 💲 - Full life cycle Cloud Native Workload Protection platform for kubernetes, virtual machines and serverless. By @deepfence
- Deepfence Threat Mapper - Powerful runtime vulnerability scanner for kubernetes, virtual machines and serverless. By @deepfence
- docker-bench-security - script that checks for dozens of common best-practices around deploying Docker containers in production. By @docker
- docker-explorer - A tool to help forensicate offline docker acquisitions by @Google
- docker-lock - A cli-plugin for docker to automatically manage image digests by tracking them in a separate Lockfile. By @safe-waters
- dvwassl - SSL-enabled Damn Vulnerable Web App to test Web Application Firewalls. By @Peco602
- KICS - an infrastructure-as-code scanning tool, find security vulnerabilities, compliance issues, and infrastructure misconfigurations early in the development cycle. Can be extended for additional policies. By Checkmarx
- notary - a server and a client for running and interacting with trusted collections. By @TUF
- oscap-docker - OpenSCAP provides oscap-docker tool which is used to scan Docker containers and images. By OpenSCAP
- Prisma Cloud 💲 - (previously Twistlock Security Suite) detects vulnerabilities, hardens container images, and enforces security policies across the lifecycle of applications.
- Sysdig Falco - Sysdig Falco is an open source container security monitor. It can monitor application, container, host, and network activity and alert on unauthorized activity.
- Sysdig Secure 💲 - Sysdig Secure addresses run-time security through behavioral monitoring and defense, and provides deep forensics based on open source Sysdig for incident response.
- Trend Micro DeepSecurity 💲 - Trend Micro DeepSecurity offers runtime protection for container workloads and hosts as well as preruntime scanning of images to identify vulnerabilities, malware and content such as hardcoded secrets.
- Trivy - Aqua Security's open source simple and comprehensive vulnerability scanner for containers (suitable for CI).
Service Discovery
- docker-consul by @progrium
- etcd - Distributed reliable key-value store for the most critical data of a distributed system by @etcd-io (former part of CoreOS)
- istio - An open platform to connect, manage, and secure microservices by @istio
- proxy 💀 - lightweight nginx based load balancer self using service discovery provided by registrator. by @factorish
- registrator - Service registry bridge for Docker by @gliderlabs and @progrium
Volume Management / Data
- Blockbridge 💲- The Blockbridge plugin is a volume plugin that provides access to an extensible set of container-based persistent storage options. It supports single and multi-host Docker environments with features that include tenant isolation, automated provisioning, encryption, secure deletion, snapshots and QoS. By @blockbridge
- Convoy 💀 - an open-source Docker volume driver that can snapshot, backup and restore Docker volumes anywhere. By @rancher
- Docker Machine NFS Activates NFS for an existing boot2docker box created through Docker Machine on OS X.
- Docker Unison A docker volume container using Unison for fast two-way folder sync. Created as an alternative to slow boot2docker volumes on OS X. By @leighmcculloch
- Docker Volume Backup Backup Docker volumes locally or to any S3 compatible storage. By @offen
- Local Persist Specify a mountpoint for your local volumes (created via
docker volume create) so that files will always persist and so you can mount to different directories in different containers. - Minio - S3 compatible object storage server in Docker containers
- Netshare Docker NFS, AWS EFS, Ceph & Samba/CIFS Volume Plugin. By @ContainX
- portworx 💲 - Decentralized storage solution for persistent, shared and replicated volumes.
- quobyte 💲 - fully fault-tolerant distributed file system with a docker volume driver
- REX-Ray provides a vendor agnostic storage orchestration engine. The primary design goal is to provide persistent storage for Docker, Kubernetes, and Mesos. By@thecodeteam (DELL Technologies)
- Storidge 💲 - Software-defined Persistent Storage for Kubernetes and Docker Swarm
User Interface
IDE integrations
- JetBrains IDEs (IntelliJ IDEA, GoLand, WebStorm, CLion etc.) has built-in Docker plugin
- Eclipse Docker Tooling plugin
- denops-docker.vim - Manage docker containers and images in Vim. By @skanehira
- docker.vim 💀 - Manage docker containers and images in Vim. By @skanehira
- docker.el Manage docker from Emacs by @Silex
Desktop
Native desktop applications for managing and montoring docker hosts and clusters
- Docker Desktop - Official native app. Only for Windows and MacOS
- Dockeron - A project built on Electron + Vue.js for Docker on desktop. @fluency03
- DockStation - A developer centric UI to configure, monitor, and manage services and containers @dock_station
- Lifeboat - An easy way to launch Docker projects with a graphical interface on your Mac. @jplhomer
- Simple Docker UI - built on Electron. By @felixgborrego
- Stevedore - Good Docker Desktop replacement for Windows. Both Linux and Windows Containers are supported. @slonopotamus
Terminal
Terminal UI
- ctop (1) - 💀 A command line / text based Linux Containers monitoring tool that works just like you expect (Python) by @yadutaf
- ctop (2) - 💀 Top-like interface for container metrics (Golang) by @bcicen
- dive - A tool for exploring each layer in a docker image. By wagoodman.
- dockdash detailed stats. By @byrnedo
- Docker-mon 💀 - Console-based Docker monitoring by @icecrime
- dockly - An interactive shell UI for managing Docker containers by @lirantal
- DockSTARTer - DockSTARTer helps you get started with home server apps running in Docker by GhostWriters
- docui - 💀 An interactive shell UI for managing Docker containers. Also works in Windows. By @skanehira
- dry - An interactive CLI for Docker containers by @moncho
- lazydocker - The lazier way to manage everything docker. A simple terminal UI for both docker and docker-compose, written in Go with the gocui library. By @jesseduffield
- oxker - A simple tui to view & control docker containers. Written in Rust, making heavy use of ratatui & Bollard, by @mrjackwills
- sen - 💀 Terminal user interface for docker engine, by @TomasTomecek
CLI tools
- captain - Easily start and stop docker compose projects from any directory. By @jenssegers
- dcinja - The powerful and smallest binary size of template engine for docker command line environment. By @Falldog
- dcp - A simple tool for copying files from container filesystems. By @exdx
- dctl - dctl is a Cli tool that helps developers by allowing them to execute all docker compose commands anywhere in the terminal, and more. By FabienD
- decompose - Reverse-engineering tool for docker environments. By @s0rg
- docker-ls - CLI tools for browsing and manipulating docker registries by @mayflower
- docker pushrm - A Docker CLI plugin that lets you push the README.md file from the current directory to Docker Hub. Also supports Quay and Harbor. By @christian-korneck
- dockersql - 💀 A command line interface to query Docker using SQL by @crosbymichael
- DVM - Docker version manager by @howtowhale
- goinside - Get inside a running docker container easily. by @iamsoorena
- ns-enter - 💀 no more ssh, enter name spaces of container by @jpetazzo
- Pdocker - A simple tool to manage and maintain Docker for personal projects by @g31s
- proco - Proco will help you to organise and manage Docker, Docker-Compose, Kubernetes projects of any complexity using simple YAML config files to shorten the route from finding your project to initialising it in your local environment. by @shiwaforce
- reg - 💀 Docker registry v2 command line client by @genuinetools
- scuba - Transparently use Docker containers to encapsulate software build environments, by @JonathonReinhart
- skopeo - Work with remote images registries - retrieving information, images, signing content by @containers
- supdock - Allows for slightly more visual usage of Docker with an interactive prompt. By @segersniels
- tsaotun - Python based Assistance for Docker by @qazbnm456
- wharfee - 💀 Autocompletion and syntax highlighting for Docker commands. by @j-bennet
Other
- dext-docker-registry-plugin - Search the Docker Registry with the Dext smart launcher. By @vutran
- docker-ssh - SSH Server for Docker containers ~ Because every container should be accessible. By @jeroenpeeters
- dockercraft - Docker + Minecraft = Dockercraft by @docker
- dockerfile-mode An emacs mode for handling Dockerfiles by @spotify
- MultiDocker - Create a secure multi-user Docker machine, where each user is segregated into an indepentent container.
- Powerline-Docker - A Powerline segment for showing the status of Docker containers by @adrianmo
Web
- Admiral Admiral™ is a highly scalable and very lightweight Container Management platform for deploying and managing container based applications. By VMWare
- CASA - Outsource the administration of a handful of containers to your co-workers, by @knrdl
- Container Web TTY - Connect your containers via a web-tty @wrfly
- dockemon - Docker Container Management GUI by @productiveops
- Docker Compose UI - Manage docker-compose via HTTP. docker-compose-ui runs in a Docker container, mounts the hosts docker socket and exposes a RESTful API and AngularJS GUI
- Docker Registry Browser - Web Interface for the Docker Registry HTTP API v2 by @klausmeyer
- Docker Registry UI (Joxit) - The simplest and cleanest UI for private registries by @Joxit
- Docker Registry UI - A web UI for easy private/local Docker Registry integration by @atcol
- docker-registry-web - Web UI, authentication service and event recorder for private docker registry v2 by @mkuchin
- docker-swarm-visualizer - Visualizes Docker services on a Docker Swarm (for running demos).
- dockering-on-rails 💀 - Simple Web-Interface for Docker with a lot of features by @Electrofenster
- DockerSurfer 💀 - A web service for analyze and browse dependencies between Docker images in the Docker registry, by @Simone-Erba
- dockge - easy-to-use and reactive self-hosted docker compose.yaml stack-oriented manager by @louislam.
- Kubevious - A highly visual web UI for Kubernetes which renders configuration and state in an application centric way by @rubenhak.
- Mafl - Minimalistic flexible homepage by @hywax
- netdata - Real-time performance monitoring
- OctoLinker - A browser extension for GitHub that makes the image name in a
Dockerfileclickable and redirect you to the related Docker Hub page. - Portainer - A lightweight management UI for managing your Docker hosts or Docker Swarm clusters by @portainer
- Rapid Dashboard - A simple query dashboard to use Docker Remote API by @ozlerhakan
- Seagull - Friendly Web UI to monitor docker daemon. by @tobegit3hub
- Swarmpit - Swarmpit provides simple and easy to use interface for your Docker Swarm cluster. You can manage your stacks, services, secrets, volumes, networks etc.
- Swirl - Swirl is a web management tool for Docker, focused on swarm cluster By @cuigh
- Theia - Extensible platform to develop full-fledged multi-language Cloud & Desktop IDE-like products with state-of-the-art web technologies.
- Yacht 🚧 - A Web UI for docker that focuses on templates and ease of use in order to make deployments as easy as possible. By @SelfhostedPro
Docker Images
Base Tools
Tools and applications that are either installed inside containers or designed to be run as a sidecar
- amicontained - Container introspection tool. Find out what container runtime is being used as well as features available by @genuinetools
- Chaperone - A single PID1 process designed for docker containers. Does user management, log management, startup, zombie reaping, all in one small package. by @garywiz
- ckron - A cron-style job scheduler for docker, by @nicomt
- CoreOS - Linux for Massive Server Deployments
- distroless - Language focused docker images, minus the operating system, by @GoogleContainerTools
- docker-alpine - A super small Docker base image (5MB) using Alpine Linux by @gliderlabs
- docker-gen - Generate files from docker container meta-data by @jwilder
- dockerize - Utility to simplify running applications in docker containers by @jwilder, @powerman
- GoSu - Run this specific application as this specific user and get out of the pipeline (entrypoint script tool) by @tianon
- is-docker - Check if the process is running inside a Docker container by @sindresorhus
- lstags - sync Docker images across registries by @ivanilves
- NVIDIA-Docker - The NVIDIA Container Runtime for Docker by @NVIDIA
- Ofelia - Ofelia is a modern and low footprint job scheduler for docker environments, built on Go. Ofelia aims to be a replacement for the old fashioned cron. Supports configuration from container labels and/or configuration files.
- SparkView - Access VMs, desktops, servers or applications anytime and from anywhere, without complex and costly client roll-outs or user management.
- su-exec - This is a simple tool that will simply execute a program with different privileges. The program will be executed directly and not run as a child, like su and sudo does, which avoids TTY and signal issues. Why reinvent gosu? This does more or less exactly the same thing as gosu but it is only 10kb instead of 1.8MB. By ncopa
- sue - Executes a program as a user different from the user running sue. This is a maintainable alternative to ncopa/su-exec, which is the better tianon/gosu. This one is far better (higher performance, smaller size), than the original gosu, however it is far easier to maintain, than su-exec, which is written in plain C. Made by Akito
- supercronic - crontab-compatible job runner, designed specifically to run in containers by @aptible
- TrivialRC - A minimalistic Runtime Configuration system and process manager for containers @vorakl
Builder
Applications designed to help or simplify building new images
- ansible-bender - A tool utilising
ansibleandbuildahby @TomasTomecek - buildah - A tool that facilitates building OCI images by @containers
- BuildKit - Concurrent, cache-efficient, and Dockerfile-agnostic builder toolkit by @moby project
- cekit - A tool used by openshift to build base images using different build engines by @cekit.
- container-diff - An image tool for comparing and analyzing container images by @GoogleContainerTools
- container-factory - Produces Docker images from tarballs of application source code by @mutable
- copy-docker-image - Copy a Docker image between registries without a full Docker installation by @mdlavin
- Derrick - A tool help you to automate the generation of Dockerfile and dockerize application by scanning the code. By @alibaba.
- dlayer - docker layer analyzer by @orisano
- docker-companion - A command line tool written in Golang to squash and unpack docker images by @mudler
- docker-make - Build, tag,and push a bunch of related docker images via a single command.
- docker-replay - Generate
docker runcommand and options from running containers. By bcicen - DockerMake - A reproducible Docker image build system for complex software stacks. By @avirshup
- DockerSlim shrinks fat Docker images creating the smallest possible images.
- Dockly - Dockly is a gem made to ease the pain of packaging an application in Docker by @swipely
- dockramp 💀 - Proof of Concept: A Client Driven Docker Image Builder by @jlhawn
- essex - Boilerplate for Docker Based Projects: Essex is a CLI utility written in bash to quickly setup clean and consistent Docker projects with Makefile driven workflows. @jamesbrink
- HPC Container Maker - Generates Dockerfiles from a high level Python recipe, including building blocks for High-Performance Computing components by @NVIDIA
- img - Standalone, daemon-less, unprivileged Dockerfile and OCI compatible container image builder by @genuinetools
- kaniko - Build Container Images In Kubernetes. By @GoogleContainerTools
- makisu - Uber's fast and flexible unprivileged image builder for Mesos and Kubernetes, with distributed cache support. By @uber
- packer - Hashicorp tool to build machine images including docker image integrated with configuration management tools like chef, puppet, ansible
- portainer - Apache Mesos framework for building Docker images by @duedil-ltd
- Production-Ready Python Containers 💲 - A template for creating production-ready Docker images for Python applications.
- RAUDI - A tool to automatically update (and optionally push to Docker Hub) Docker Images for 3rd party software whenever theres is a new release/update/commit. By @SecSI
- runlike - Generate
docker runcommand and options from running containers by @lavie - SkinnyWhale 💀 - Skinnywhale helps you make smaller (as in megabytes) Docker containers.
- Smith - A Micocontainer Builder and can perform multi-stage builds after the image is built Oracle
- userdef - An advanced
adduserfor your Alpine based Docker images. Made by Akito - Whaler - Program to reverse Docker images into Dockerfiles by @P3GLEG.
- Whales - A tool to automatically dockerize your applications by @icalialabs.
Dockerfile
- chaperone-docker - A set of images using the Chaperone process manager, including a lean Alpine image, LAMP, LEMP, and bare-bones base kits.
- Dockerfile Generator
dfgis both a Go library and an executable that produces valid Dockerfiles using various input channels. - Dockerfile Project - Trusted Automated Docker Builds. Dockerfile Project maintains a central repository of Dockerfile for various popular open source software services runnable on a Docker container.
- dockerfilegraph - Visualize your multi-stage Dockerfiles. By @PatrickHoefler
- Dockershelf - A repository that serves as a collector for docker recipes that are universal, efficient and slim. Images are updated, tested and published daily via a Travis cron job. Maintained by @CollageLabs.
- dockmoor 🚧 - Manage docker image references and help to create reproducible builds with Docker. By @MeneDev
- Vektorcloud - A collection of minimal, Alpine-based Docker images
Examples by:
Linter
- docker-image-size-limit - A tool to keep an eye on your docker images size.
- Dockerfile Linter action - The linter lets you verify Dockerfile syntax to make sure it follows the best practices for building efficient Docker images.
- dockfmt 🚧 - Dockerfile formatter and parser by @jessfraz
- FROM:latest - An opinionated Dockerfile linter by @replicatedhq
- Hadolint - A Dockerfile linter that checks for best practices, common mistakes, and is also able to lint any bash written in
RUNinstructions; by @lukasmartinelli - Whale-linter - A simple and small Dockerfile linter written in Python3+ without dependencies by @jeromepin
Metadata
- opencontainer - A convention and shared namespace for Docker labels defined by OCI Image Spec.
Registry
Services to securely store your Docker images.
- Amazon Elastic Container Registry 💲 - Amazon Elastic Container Registry (ECR) is a fully-managed Docker container registry that makes it easy for developers to store, manage, and deploy Docker container images.
- Azure Container Registry 💲 - Manage a Docker private registry as a first-class Azure resource
- CargoOS - A bare essential OS for running the Docker Engine on bare metal or Cloud. By @RedCoolBeans
- cleanreg - A small tool to delete image manifests from a Docker Registry implementing the API v2, dereferencing them for the GC by @hcguersoy
- Cloudsmith 💲 - A fully managed package management SaaS, with first-class support for public and private Docker registries (and many others, incl. Helm charts for the Kubernetes ecosystem). Has a generous free-tier and is also completely free for open-source.
- Container Registry Service 💲 - Harbor based Container Management Solution as a Service for teams and organizations. Free tier offers 1 GB storage for private repositories.
- Cycle.io 💲 - Bare-metal container hosting.
- DigitalOcean 💲 - DigitalOcean Container Registry.
- Docker Hub provided by Docker Inc.
- Docker Registry v2 - The Docker toolset to pack, ship, store, and deliver content
- Docket - Custom docker registry that allows for lightning fast deploys through bittorrent by @netvarun
- Dragonfly - Provide efficient, stable and secure file distribution and image acceleration based on p2p technology.
- GCE Container Registry 💲 Fast, private Docker image storage on Google Cloud Platform
- Gitea Container Registry - Integrated Docker registry in Gitea, ideal for private, small-scale image hosting.
- GitHub Container Registry - GitHub's solution for storing and managing Docker images, with tight integration into GitHub Actions.
- GitLab Container Registry - Registry focused on using its images in GitLab CI
- Harbor An open source trusted cloud native registry project that stores, signs, and scans content. Supports replication, user management, access control and activity auditing. By CNCF formerly VMWare
- JFrog Artifactory 💲 - Artifact Repository Manager, can be used as private Docker Registry as well
- Kraken - Uber's Highly scalable P2P docker registry, capable of distributing TBs of data in seconds.
- Quay.io 💲 (part of CoreOS) - Secure hosting for private Docker repositories
- Registryo - UI and token based authentication server for onpremise docker registry
- Rescoyl - Private Docker registry (free and open source) by @noteed
- Sonatype Nexus Repository - Manage binaries and build artifacts across your software supply chain.
Development with Docker
API Client
- ahab - Docker event handling with Python by @instacart
- clj-docker-client 💀 - Idiomatic Clojure client for the Docker remote API. By @lispyclouds
- contajners - An idiomatic, data-driven, REPL friendly Clojure client for OCI container engines. By @lispyclouds
- Docker Client for JVM - A Docker remote api client library for the JVM, written in Groovy by @gesellix
- Docker Client TypeScript - Docker API client for JavaScript, automatically generated from Swagger API definition from moby repository. By @masaeedu
- docker-client 💀 - Java client for the Docker remote API. By @spotify
- docker-it-scala - Docker integration testing kit with Scala by @whisklabs
- docker-java-api - Lightweight, truly object-oriented, Java client for Docker's API. By @amihaiemil
- docker-maven-plugin - A Maven plugin for running and creating Docker images by @fabric8io
- Docker-PowerShell - PowerShell Module for Docker
- Docker.DotNet - C#/.NET HTTP client for the Docker remote API by @ahmetb
- Docker.Registry.DotNet - .NET (C#) Client Library for interacting with a Docker Registry API (v2) @rquackenbush
- dockerfile-maven - A Maven plugin for building and pushing Docker images by @spotify
- dockerode - Docker Remote API node.js module by @apocas
- DoMonit - A simple Docker Monitoring wrapper For Docker API
- go-dockerclient - Go HTTP client for the Docker remote API by @fsouza
- Gradle Docker plugin - A Docker remote api plugin for Gradle by @gesellix
- libcompose - Go library for Docker Compose.
- Portainer stack utils 🚧 - Bash script to deploy/update/undeploy Docker stacks in a Portainer instance from a docker-compose yaml file. By @greenled.
- sbt-docker-compose - Integrates Docker Compose functionality into sbt by @kurtkopchik
- sbt-docker - Create Docker images directly from sbt by @marcuslonnberg
CI/CD
- Buddy 💲 - The best of Git, build & deployment tools combined into one powerful tool that supercharged our development.
- Captain - Convert your Git workflow to Docker containers ready for Continuous Delivery by @harbur.
- Cyclone - Powerful workflow engine and end-to-end pipeline solutions implemented with native Kubernetes resources by @caicloud.
- Depot 💲 - Build Docker images fast, in the cloud. Blazing fast compute, automatic intelligent caching, and zero configuration. Done in seconds.
- Diun - Receive notifications when an image or repository is updated on a Docker registry by @crazy-max.
- dockcheck - A script checking updates for docker images without pulling then auto-update selected/all containers. With notifications, pruning and more.
- Docker plugin for Jenkins - The aim of the docker plugin is to be able to use a docker host to dynamically provision a slave, run a single build, then tear-down that slave.
- Drone - Continuous integration server built on Docker and configured using YAML files.
- Gantry - Automatically update selected Docker swarm services.
- GitLab Runner - GitLab has integrated CI to test, build and deploy your code with the use of GitLab runners.
- GOCD-Docker 💀 - Go Server and Agent in docker containers to provision.
- Jaypore CI - Simple, very flexible, powerful CI / CD / automation system configured in Python. Offline and local first.
- Kraken CI - Modern CI/CD, open-source, on-premise system that is highly scalable and focused on testing. One of its executors is Docker. Developed by @Kraken-CI.
- Microservices Continuous Deployment - Continuous deployment of a microservices application.
- mu - Tool to configure CI/CD of your container applications via AWS CodePipeline, CodeBuild and ECS @Stelligent
- Ouroboros 💀 - Automatically update running Docker containers with notifications
- Popper - Github actions workflow (HCL syntax) execution engine.
- Screwdriver 💲 - Yahoo's OpenSource buildplatform designed for Continous Delivery.
- Skipper - Easily dockerize your Git repository by @Stratoscale
- SwarmCI - Create a distributed, isolated task pipeline in your Docker Swarm.
- Tekton CD - A cloud-native pipeline resource.
- Watchtower - Automatically update running Docker containers
Development Environment
- batect - build and testing environments as code tool: Dockerised build and testing environments made easy by @charleskorn
- Binci - Containerize your development workflow. (formerly DevLab by @TechnologyAdvice)
- Boot2Docker 💀 - Docker for OSX and Windows
- coder - remote development machines powered by Terraform or Docker by @coder
- construi - Run your builds inside a Docker defined environment by @lstephen
- Crashcart - Sideload Linux binaries into a running container for troubleshooting by @Oracle
- dde 🚧 - Local development environment toolset based on Docker. By @whatwedo
- Devstep 💀 - Development environments powered by Docker and buildpacks by @fgrehm
- Dinghy - An alternative way to use Docker on Mac OS X using Docker Machine with virtualbox, vmware, xhyve or parallels
- DIP - CLI utility for straightforward provisioning and interacting with an application configured by docker-compose. By @bibendi
- DLite 💀 - Simplest way to use Docker on OSX, no VM needed. By @nlf
- dobi - A build automation tool for Docker applications. By @dnephin
- Docker Missing Tools - A set of bash commands to shortcut typical docker dev-ops. An alternative to creating typical helper scripts like "build.sh" and "deploy.sh" inside code repositories. By @NandoQuintana.
- Docker osx dev 💀 - A productive development environment with Docker on OS X by @brikis98
- Docker-Arch - Generate Web/CLI projects Dockerized development environments, from 1 simple YAML file. By @Ph3nol
- Docker-sync - Drastically improves performance (50-70x) when using Docker for development on Mac OS X/Windows and Linux while sharing code to the container. By @EugenMayer
- docker-vm - Simple and transparent alternative to boot2docker (backed by Vagrant) by @shyiko
- DockerBuildManagement - Build Management is a python application, installed with pip. The application makes it easy to manage a build system based on Docker by configuring a single yaml file describing how to build, test, run or publish a containerized solution.
- DockerDL - Deep Learning Docker Images. Don't waste time setting up a deep learning env when you can get a deep learning environment with everything pre-installed.
- Dusty - Managed Docker development environments on OS X
- Eclipse Che - Developer workspace server with Docker runtimes, cloud IDE, next-generation Eclipse IDE
- EnvCLI - Replace your local installation of Node, Go, ... with project-specific docker containers. By @EnvCLI
- ESP32 Linux - Docker builder - Container solution to compile Linux and develop it for ESP32 microcontrollers - By @Hpsaturn
- footloose - Spin containers that look like Virtual Machines - By @dlespiau
- forward2docker 💀 - Utility to auto forward a port from localhost into ports on Docker containers running in a boot2docker VM by @bsideup
- Gebug - A tool that makes debugging of Dockerized Go applications super easy by enabling Debugger and Hot-Reload features, seamlessly.
- Kitt - A portable and disposable Shell environment, based on Docker and Nix. By @senges
- Lando - Lando is for developers who want to quickly specify and painlessly spin up the services and tools needed to develop their projects. By Tandem
- Rust Universal Compiler - Container solution to compile Rust projects for Linux, macOS and Windows. By @Peco602
- uniget - uni(versal)get, the installer and updater for container tools and beyond (formerly docker-setup). By @nicholasdille
- Vagga - Vagga is a containerisation tool without daemons. It is a fully-userspace container engine inspired by Vagrant and Docker, specialized for development environments by @tailhook
- Zsh-in-Docker - Install Zsh, Oh-My-Zsh and plugins inside a Docker container with one line! By Deluan
Garbage Collection
- caduc - A docker garbage collector cleaning stuff you did not use recently
- Docker Clean - A script that cleans Docker containers, images and volumes by @zzrotdesign
- docker_gc - Image for automatic removing unused Docker Swarm objects. Also works just as Docker Service by @pdacity
- Docker-cleanup 💀 - Automatic Docker image, container and volume cleanup by @meltwater
- docker-custodian - Keep docker hosts tidy. By @Yelp
- docker-garby - Docker garbage collection script by @konstruktoid.
- docker-gc 💀 - A cron job that will delete old stopped containers and unused images by @spotify
- Docuum - Least recently used (LRU) eviction of Docker images by @stepchowfun
- sherdock 💀 - Automatic GC of images based on regexp by @rancher
Serverless
- AMP 💀 - The open source unified CaaS/FaaS platform for Docker, batteries included. By @Appcelerator
- Apache OpenWhisk - a serverless, open source cloud platform that executes functions in response to events at any scale. By @apache
- Docker-Lambda - Docker images and test runners that replicate the live AWS Lambda environment. By @lamb-ci
- Funker - Functions as Docker containers example voting app. By @bfirsh
- IronFunctions - The serverless microservices platform FaaS (Functions as a Service) which uses Docker containers to run Any language or AWS Lambda functions
- Koyeb 💲 - Koyeb is a developer-friendly serverless platform to deploy apps globally. Seamlessly run Docker containers, web apps, and APIs with git-based deployment, native autoscaling, a global edge network, and built-in service mesh and discovery.
- OpenFaaS - A complete serverless functions framework for Docker and Kubernetes. By OpenFaaS
- SCAR - Serverless Container-aware Architectures (SCAR) is a serverless framework that allows easy deployment and execution of containers (e.g. Docker) in Serverless environments (e.g. Lambda) by @grycap
Testing
- Container Structure Test - A framework to validate the structure of an image by checking the outputs of commands or the contents of the filesystem. By @GoogleContainerTools
- dgoss - A fast YAML based tool for validating docker containers.
- DockerSpec - A small Ruby Gem to run RSpec and Serverspec, Infrataster and Capybara tests against Dockerfiles or Docker images easily. By @zuazo
- Dockunit 💀 - Docker based integration tests. A simple Node based utility for running Docker based unit tests. By @dockunit
- EZDC - Golang test harness for easily setting up tests that rely on services in a docker-compose.yml. By @byrnedo
- InSpec - InSpec is an open-source testing framework for infrastructure with a human- and machine-readable language for specifying compliance, security and policy requirements. By @chef
- Kurtosis - A composable build system for multi-container test environments that provides developers with: a powerful Python-like SDK for environment configuration, a compile-time validator to verify environment behavior & setup, and a runtime for environment execution, monitoring, & debugging capabilities. By Kurtosis
- Pull Dog - A GitHub app that automatically creates Docker-based test environments for your pull requests, from your docker-compose files. Not open source.
- Pumba - Chaos testing tool for Docker. Can be deployed on kubernetes and CoreOS cluster. By @alexei-led
Wrappers
- Ansible - Manage the life cycle of Docker containers. By RedHat
- Azk - Orchestrate development environments on your local machine by @azukiapp
- Beluga 💀 - CLI to deploy docker containers on a single server or low amount of servers. By @cortextmedia
- dexec - Command line interface written in Go for running code with Docker Exec images.
- dockerized - Seamlessly execute commands in a container.
- Dray - An engine for managing the execution of container-based workflows by @CenturyLinkLabs
- FuGu 💀 - Docker run wrapper without orchestration by @mattes
- Hokusai - A Docker + Kubernetes CLI for application developers; used to containerize an application and to manage its lifecycle throughout development, testing, and release cycles. From @artsy
- Preevy - Preview environments for Docker and Docker Compose projects. Test your changes and get feedback from devs and non-devs (Product/Design) by deploying pull requests to the your cloud provider as part of your CI pipeline.
- Shutit - Tool for building and maintaining complex Docker deployments by @ianmiell
- subuser - Makes it easy to securely and portably run graphical desktop applications in Docker
- T.A.D.S. boilerplate - The power of Ansible and Terraform + the simplicity of Docker Swarm = Infrastructure as Code and DevOps best practices. By @Thomvaill
- Terraform cloud-init config - Terraform module for deploying a single Docker image or
docker-compose.yamlfile to any Cloud™ VM - Turbo - Simple and Powerful utility for docker. By @ramitsurana
- udocker - A tool to execute simple docker containers in batch or interactive systems without root privileges by @inidigo-dc
- Vagrant - Docker provider - Good starting point is vagrant-docker-example by @bubenkoff
Services based on Docker (mostly 💲)
CI Services
- CircleCI 💲 - Push or pull Docker images from your build environment, or build and run containers right on CircleCI.
- CodeFresh 💲 - Everything you need to build, test, and share your Docker applications. Provides automated end to end testing.
- CodeShip 💲 - Work with your established Docker workflows while automating your testing and deployment tasks with our hosted platform dedicated to speed and security.
- ConcourseCI 💲 - A CI SaaS platform for developers and DevOps teams pipeline oriented.
- Semaphore CI 💲 — A high-performance cloud solution that makes it easy to build, test and ship your containers to production.
- TravisCI 💲 - A Free github projects continuous integration Saas platform for developers and Devops.
CaaS
- Amazon ECS 💲 - A management service on EC2 that supports Docker containers.
- Appfleet 💲 - Edge platform to deploy and manage containerized services globally. The system will route the traffic to the closest location for lower latency.
- Azure AKS 💲 - Simplify Kubernetes management, deployment, and operations. Use a fully managed Kubernetes container orchestration service.
- Cloud 66 💲 - Full-stack hosted container management as a service
- Dockhero 💲 - Dockhero is a Heroku add-on which turns a Docker image into a microservice attached to the Heroku app. Currently in beta.
- Giant Swarm 💲 - Simple microservice infrastructure. Deploy your containers in seconds.
- Google Container Engine 💲 - Docker containers on Google Cloud Computing powered by Kubernetes.
- Mesosphere DC/OS Platform 💲 - Integrated platform for data and containers built on Apache Mesos by @mesosphere
- Red Hat CodeReady Workspaces - A collaborative Kubernetes-native solution for rapid application development that delivers consistent developer environments on Red Hat OpenShift to allow anyone with a browser to contribute code in under two minutes.
- Red Hat OpenShift Dedicated 💲 - Fully-managed Red Hat® OpenShift® service on Amazon Web Services and Google Cloud
- Triton 💲 - Elastic container-native infrastructure by Joyent.
- Virtuozzo Application Platform 💲 - Deploy and manage your projects with turnkey PaaS across a wide network of reliable service providers
Monitoring Services
- AppDynamics - Docker Monitoring extension gathers metrics from the Docker Remote API, either using Unix Socket or TCP.
- Better Stack 💲 - A Docker-compatible observability stack that delivers robust log aggregation and uptime monitoring capabilities for various software application.
- Broadcom Docker Monitoring 💲 - Agile Operations solutions from Broadcom deliver the modern Docker monitoring businesses need to accelerate and optimize the performance of microservices and the dynamic Docker environments running them. Monitor both the Docker environment and apps that run inside them. (former CA Technologies)
- Collecting docker logs and stats with Splunk
- Datadog 💲 - Datadog is a full-stack monitoring service for large-scale cloud environments that aggregates metrics/events from servers, databases, and applications. It includes support for Docker, Kubernetes, and Mesos.
- Prometheus 💲 - Open-source service monitoring system and time series database
- Site24x7 💲 - Docker Monitoring for DevOps and IT is a SaaS Pay per Host model
- SPM for Docker 💲 - Monitoring of host and container metrics, Docker events and logs. Automatic log parser. Anomaly Detection and alerting for metrics and logs. @sematext
- Sysdig Monitor 💲 - Sysdig Monitor can be used as either software or a SaaS service to monitor, alert, and troubleshoot containers using system calls. It has container-specific features for Docker and Kubernetes.
Useful Resources
- Valuable Docker Links High quality articles about docker! MUST SEE
- Become a Docker Power User with Visual Studio Code - 💲 A training course to help you become a Docker Power user with Visual Studio Code
- Cloud Native Landscape
- Docker Blog - regular updates about Docker, the community and tools
- Docker Certification 💲 will help you to will Learn Docker containerization, running Docker containers, Image creation, Dockerfile, Docker orchestration, security best practices, and more through hands-on projects and case studies and helps to clear Docker Certified Associate.
- Docker Community on Hashnode
- Docker dev bookmarks - use the tag docker
- Docker in Action, Second Edition
- Docker in Practice, Second Edition
- Docker packaging guide for Python - a series of detailed articles on the specifics of Docker packaging for Python.
- Learn Docker in a Month of Lunches
- Learn Docker - Learn Docker - curated list of the top online docker tutorials and courses.
- Programming Community Curated Resources for learning Docker
Awesome Lists
- Awesome CI/CD - Not specific to docker but relevant.
- Awesome Compose - Docker Compose samples
- Awesome Kubernetes by @ramitsurana
- Awesome Linux Container more general about container than this repo, by @Friz-zy.
- Awesome Selfhosted list of Free Software network services and web applications which can be hosted locally by running in a classical way (setup local web server and run applications from there) or in a Docker container. By @Kickball
- Awesome Sysadmin by @n1trux
- ToolsOfTheTrade a list of SaaS and On premise applications by @cjbarber
Demos and Examples
- An Annotated Docker Config for Frontend Web Development A local development environment with Docker allows you to shrink-wrap the devops your project needs as config, making onboarding frictionless.
- Local Docker DB a list of docker-compose samples for a lot of databases by @alexmacarthur
- Webstack-micro Demo web app showing how Docker Compose might be used to set up an API Gateway, centralized authentication, background workers, and WebSockets as containerized services.
Good Tips
- Docker Caveats What You Should Know About Running Docker In Production (written 11 APRIL 2016) MUST SEE
- Docker Containers on the Desktop - The funniest way to learn about docker by @jessfraz who also gave a presentation about it @ DockerCon 2015
- Docker vs. VMs? Combining Both for Cloud Portability Nirvana
- Dockerfile best practices - This repository has best-practices for writing Dockerfiles
- Don't Repeat Yourself with Anchors, Aliases and Extensions in Docker Compose Files by @King Chung Huang
- GUI Apps with Docker by @fgrehm
Raspberry Pi & ARM
- Docker Pirates ARMed with explosive stuff Huge resource on clustering, swarm, docker, pre-installed image for SD card on Raspberry Pi
- Get Docker up and running on the RaspberryPi in three steps
- git push docker containers to linux devices Modern DevOps for IoT, leveraging git and Docker.
- Installing, running, using Docker on armhf (ARMv7) devices
Security
- Bringing new security features to Docker
- CVE Scanning Alpine images with Multi-stage builds in Docker 17.05 by @tomwillfixit
- Docker Secure Deployment Guidelines
- Docker Security - Quick Reference
- Docker Security: Are Your Containers Tightly Secured to the Ship? SlideShare
- How CVE's are handled on Offical Docker Images
- Lynis is an open source security auditing tool including Docker auditing
- Security Best Practices for Building Docker Images
- Software Engineering Radio interview of Docker Security Team Lead (Diogo Mónica)
- Ten Docker Image Security Best Practices Cheat Sheet
- Top ten most popular docker images each contain at least 30 vulnerabilities
- Tuning Docker with the newest security enhancements
- 10 best practices to containerize Node.js web applications with Docker
Videos
- Contributing to Docker by Andrew "Tianon" Page (InfoSiftr) (34:31)
- Deploying and scaling applications with Docker, Swarm, and a tiny bit of Python magic (3:11:06) by @jpetazzo
- Docker and SELinux by Daniel Walsh from Red Hat (40:23)
- Docker Course (Spanish) by @pablokbs
- Docker for Developers (54:26) by @jpetazzo <== Good introduction, context, demo
- Docker from scratch (1:22:01) on YouTube by Paris Nakita Kejser
- Docker: How to Use Your Own Private Registry (15:01)
- Docker in Production by @jpetazzo (36:05)
- Docker Primer to Docker Compose (1:56:45) on YouTube by LoginRadius
- Docker Registry from scratch (44:40) on YouTube by Paris Nakita Kejser
- Docker Swarm from scratch (1:41:28) on YouTube by Paris Nakita Kejser
- Extending Docker with Plugins (15:21)
- From Local Docker Development to Production Deployments by @jpetazzo @ AWS re:Invent 2015
- Immutable Infrastructure with Docker and EC2 by Michael Bryzek (Gilt) (42:04)
- Introduction to Docker and containers (3:09:00) by @jpetazzo
- Logging on Docker: What You Need to Know (51:27)
- Performance Analysis of Docker - Jeremy Eder (1:36:58)
- Scalable Microservices with Kubernetes Free Udacity course
- State of containers: a debate with CoreOS, VMware and Google (27:38)
Communities and Meetups
Brazilian
Chinese
- DockerOne Docker Community (in Chinese) by @LiYingJie
English
Russian
Spanish
Stargazers over time
Instalação Docker
Install Docker Desktop on Windows
Link: https://docs.docker.com/desktop/setup/install/windows-install/
Docker Desktop terms
Commercial use of Docker Desktop in larger enterprises (more than 250 employees OR more than $10 million USD in annual revenue) requires a paid subscription.
This page provides download links, system requirements, and step-by-step installation instructions for Docker Desktop on Windows.
For checksums, see Release notes
System requirements
Tip
Should I use Hyper-V or WSL?
Docker Desktop's functionality remains consistent on both WSL and Hyper-V, without a preference for either architecture. Hyper-V and WSL have their own advantages and disadvantages, depending on your specific setup and your planned use case.
- WSL version 1.1.3.0 or later.
- Windows 11 64-bit: Home or Pro version 22H2 or higher, or Enterprise or Education version 22H2 or higher.
- Windows 10 64-bit: Minimum required is Home or Pro 22H2 (build 19045) or higher, or Enterprise or Education 22H2 (build 19045) or higher.
- Turn on the WSL 2 feature on Windows. For detailed instructions, refer to the Microsoft documentation.
- The following hardware prerequisites are required to successfully run WSL 2 on Windows 10 or Windows 11:
- 64-bit processor with Second Level Address Translation (SLAT)
- 4GB system RAM
- Enable hardware virtualization in BIOS/UEFI. For more information, see Virtualization.
For more information on setting up WSL 2 with Docker Desktop, see WSL.
-
Windows 11 64-bit: Enterprise, Pro, or Education version 22H2 or higher.
-
Windows 10 64-bit: Enterprise, Pro, or Education version 22H2 (build 19045) or higher.
-
Turn on Hyper-V and Containers Windows features.
-
The following hardware prerequisites are required to successfully run Client Hyper-V on Windows 10:
- 64 bit processor with Second Level Address Translation (SLAT)
- 4GB system RAM
- Turn on BIOS/UEFI-level hardware virtualization support in the BIOS/UEFI settings. For more information, see Virtualization.
Note
Docker only supports Docker Desktop on Windows for those versions of Windows that are still within Microsoft’s servicing timeline. Docker Desktop is not supported on server versions of Windows, such as Windows Server 2019 or Windows Server 2022. For more information on how to run containers on Windows Server, see Microsoft's official documentation.
Important
To run Windows containers, you need Windows 10 or Windows 11 Professional or Enterprise edition. Windows Home or Education editions only allow you to run Linux containers.
Containers and images created with Docker Desktop are shared between all user accounts on machines where it is installed. This is because all Windows accounts use the same VM to build and run containers. Note that it is not possible to share containers and images between user accounts when using the Docker Desktop WSL 2 backend.
Running Docker Desktop inside a VMware ESXi or Azure VM is supported for Docker Business customers. It requires enabling nested virtualization on the hypervisor first. For more information, see Running Docker Desktop in a VM or VDI environment.
From the Docker Desktop menu, you can toggle which daemon (Linux or Windows) the Docker CLI talks to. Select Switch to Windows containers to use Windows containers, or select Switch to Linux containers to use Linux containers (the default).
For more information on Windows containers, refer to the following documentation:
-
Microsoft documentation on Windows containers.
-
Build and Run Your First Windows Server Container (Blog Post) gives a quick tour of how to build and run native Docker Windows containers on Windows 10 and Windows Server 2016 evaluation releases.
-
Getting Started with Windows Containers (Lab) shows you how to use the MusicStore application with Windows containers. The MusicStore is a standard .NET application and, forked here to use containers, is a good example of a multi-container application.
-
To understand how to connect to Windows containers from the local host, see I want to connect to a container from Windows
Note
When you switch to Windows containers, Settings only shows those tabs that are active and apply to your Windows containers.
If you set proxies or daemon configuration in Windows containers mode, these apply only on Windows containers. If you switch back to Linux containers, proxies and daemon configurations return to what you had set for Linux containers. Your Windows container settings are retained and become available again when you switch back.
Install Docker Desktop on Windows
Tip
See the FAQs on how to install and run Docker Desktop without needing administrator privileges.
Install interactively
-
Download the installer using the download button at the top of the page, or from the release notes.
-
Double-click
Docker Desktop Installer.exeto run the installer. By default, Docker Desktop is installed atC:\Program Files\Docker\Docker. -
When prompted, ensure the Use WSL 2 instead of Hyper-V option on the Configuration page is selected or not depending on your choice of backend.
On systems that support only one backend, Docker Desktop automatically selects the available option.
-
Follow the instructions on the installation wizard to authorize the installer and proceed with the installation.
-
When the installation is successful, select Close to complete the installation process.
If your administrator account is different to your user account, you must add the user to the docker-users group:
- Run Computer Management as an administrator.
- Navigate to Local Users and Groups > Groups > docker-users.
- Right-click to add the user to the group.
- Sign out and sign back in for the changes to take effect.
Install from the command line
After downloading Docker Desktop Installer.exe, run the following command in a terminal to install Docker Desktop:
$ "Docker Desktop Installer.exe" install
If you’re using PowerShell you should run it as:
Start-Process 'Docker Desktop Installer.exe' -Wait installIf using the Windows Command Prompt:
start /w "" "Docker Desktop Installer.exe" installBy default, Docker Desktop is installed at C:\Program Files\Docker\Docker.
Installer flags
Note
If you're using PowerShell, you need to use the
ArgumentListparameter before any flags. For example:Start-Process 'Docker Desktop Installer.exe' -Wait -ArgumentList 'install', '--accept-license'
If your admin account is different to your user account, you must add the user to the docker-users group:
$ net localgroup docker-users <user> /add
The install command accepts the following flags:
Installation behavior
--quiet: Suppresses information output when running the installer--accept-license: Accepts the Docker Subscription Service Agreement now, rather than requiring it to be accepted when the application is first run--installation-dir=<path>: Changes the default installation location (C:\Program Files\Docker\Docker)--backend=<backend name>: Selects the default backend to use for Docker Desktop,hyper-v,windowsorwsl-2(default)--always-run-service: After installation completes, startscom.docker.serviceand sets the service startup type to Automatic. This circumvents the need for administrator privileges, which are otherwise necessary to startcom.docker.service.com.docker.serviceis required by Windows containers and Hyper-V backend.
Security and access control
--allowed-org=<org name>: Requires the user to sign in and be part of the specified Docker Hub organization when running the application--admin-settings: Automatically creates anadmin-settings.jsonfile which is used by admins to control certain Docker Desktop settings on client machines within their organization. For more information, see Settings Management.- It must be used together with the
--allowed-org=<org name>flag. - For example:
--allowed-org=<org name> --admin-settings="{'configurationFileVersion': 2, 'enhancedContainerIsolation': {'value': true, 'locked': false}}"
- It must be used together with the
--no-windows-containers: Disables the Windows containers integration. This can improve security. For more information, see Windows containers.
Proxy configuration
--proxy-http-mode=<mode>: Sets the HTTP Proxy mode,system(default) ormanual--override-proxy-http=<URL>: Sets the URL of the HTTP proxy that must be used for outgoing HTTP requests, requires--proxy-http-modeto bemanual--override-proxy-https=<URL>: Sets the URL of the HTTP proxy that must be used for outgoing HTTPS requests, requires--proxy-http-modeto bemanual--override-proxy-exclude=<hosts/domains>: Bypasses proxy settings for the hosts and domains. Uses a comma-separated list.--proxy-enable-kerberosntlm: Enables Kerberos and NTLM proxy authentication. If you are enabling this, ensure your proxy server is properly configured for Kerberos/NTLM authentication. Available with Docker Desktop 4.32 and later.
Data root and disk location
--hyper-v-default-data-root=<path>: Specifies the default location for the Hyper-V VM disk.--windows-containers-default-data-root=<path>: Specifies the default location for the Windows containers.--wsl-default-data-root=<path>: Specifies the default location for the WSL distribution disk.
Start Docker Desktop
Docker Desktop does not start automatically after installation. To start Docker Desktop:
-
Search for Docker, and select Docker Desktop in the search results.
-
The Docker menu (
 ) displays the Docker Subscription Service Agreement.
Here’s a summary of the key points:
- Docker Desktop is free for small businesses (fewer than 250 employees AND less than $10 million in annual revenue), personal use, education, and non-commercial open source projects.
- Otherwise, it requires a paid subscription for professional use.
- Paid subscriptions are also required for government entities.
- The Docker Pro, Team, and Business subscriptions include commercial use of Docker Desktop.
-
Select Accept to continue. Docker Desktop starts after you accept the terms.
Note that Docker Desktop won't run if you do not agree to the terms. You can choose to accept the terms at a later date by opening Docker Desktop.
For more information, see Docker Desktop Subscription Service Agreement. It is recommended that you read the FAQs.
Tip
As an IT administrator, you can use endpoint management (MDM) software to identify the number of Docker Desktop instances and their versions within your environment. This can provide accurate license reporting, help ensure your machines use the latest version of Docker Desktop, and enable you to enforce sign-in.
Where to go next
- Explore Docker's subscriptions to see what Docker can offer you.
- Get started with Docker.
- Explore Docker Desktop and all its features.
- Troubleshooting describes common problems, workarounds, and how to get support.
- FAQs provide answers to frequently asked questions.
- Release notes lists component updates, new features, and improvements associated with Docker Desktop releases.
- Back up and restore data provides instructions on backing up and restoring data related to Docker.
Repositório Docker Linux Server
Link: https://www.linuxserver.io/our-images
| Name | Architectures | Tags | Categories | Latest Version | First Build | Last Build |
|---|
| adguardhome-sync | x86_64, arm64 | latest | Network, DNS | v0.7.8-ls143 | 2021-04-08 | 2025-08-13 06:54:25 | |
 |
airsonic-advanced | x86_64, arm64 | latest | Media Servers, Music | 11.1.4-ls155 | 2022-01-02 | 2025-08-16 09:26:09 |
| altus | x86_64, arm64 | latest | Chat | 5.7.1-ls91 | 2023-12-07 | 2025-08-14 18:53:29 | |
| apprise-api | x86_64, arm64 | latest | Monitoring | v1.2.1-ls203 | 2021-02-26 | 2025-08-11 10:10:37 | |
| ardour | x86_64, arm64 | latest | Audio Processing | 2025-07-12-ls103 | 2024-04-10 | 2025-08-14 18:50:09 | |
| audacity | x86_64 | latest | Audio Processing | 3.7.5-ls219 | 2021-04-07 | 2025-08-19 05:09:36 | |
| babybuddy | x86_64, arm64 | latest | Family | v2.7.1-ls205 | 2021-06-22 | 2025-08-17 21:37:51 | |
| bambustudio | x86_64 | latest | 3D Printing | v02.02.00.85-ls102 | 2023-11-15 | 2025-08-16 13:33:37 | |
 |
bazarr | x86_64, arm64 | latest, development | Media Management | v1.5.2-ls315 | 2018-09-11 | 2025-08-19 21:39:16 |
| beets | x86_64, arm64 | latest, nightly | Music | 2.3.1-ls284 | 2015-11-29 | 2025-08-15 19:01:14 | |
| blender | x86_64, arm64 | latest | 3D Modeling | 4.5.2-ls180 | 2022-03-12 | 2025-08-21 15:06:06 | |
| boinc | x86_64, arm64 | latest | Science | 8.0.4dfsg202502052140ubuntu24.04.1-ls78 | 2020-03-15 | 2025-08-19 12:10:02 | |
| bookstack | x86_64, arm64 | latest | Content Management | v25.07.1-ls217 | 2018-07-02 | 2025-08-18 18:42:12 | |
| brave | x86_64, arm64 | latest | Web Browser | 1.81.136-ls35 | 2025-06-06 | 2025-08-20 18:02:18 | |
| budge | x86_64, arm64 | latest | Finance | 0.0.9-ls162 | 2022-05-02 | 2025-08-17 03:21:26 | |
| calibre | x86_64, arm64 | latest, v4 | Books | v8.8.0-ls350 | 2019-04-29 | 2025-08-20 07:08:47 | |
| calibre-web | x86_64, arm64 | latest, nightly | Books | 0.6.24-ls343 | 2017-07-17 | 2025-08-17 02:43:07 | |
| calligra | x86_64, arm64 | latest | Documents | 3.2.1-ls86 | 2023-12-07 | 2025-08-21 10:31:48 | |
| changedetection.io | x86_64, arm64 | latest | Web Tools, Automation | 0.50.10-ls211 | 2022-08-07 | 2025-08-19 17:51:47 | |
| chrome | x86_64 | latest | Web Browser | 139.0.7258.138-1-ls29 | 2025-06-12 | 2025-08-19 21:02:11 | |
| chromium | x86_64, arm64 | latest, kasm | Web Browser | ecfbfc38-ls17 | 2023-03-18 | 2025-08-20 09:51:28 | |
 |
code-server | x86_64, arm64 | latest | Programming | 4.103.1-ls293 | 2019-06-24 | 2025-08-16 02:35:31 |
| cops | x86_64, arm64 | latest | Books | 3.6.5-ls267 | 2016-08-12 | 2025-08-10 21:01:50 | |
| cura | x86_64 | latest | 3D Printing | 5.10.2-ls93 | 2023-11-15 | 2025-08-14 19:19:47 | |
| darktable | x86_64, arm64 | latest | Photos | 2025-07-12-ls218 | 2021-04-07 | 2025-08-14 19:22:54 | |
 |
davos | x86_64, arm64 | latest | FTP | 2.2.2-ls214 | 2016-11-18 | 2025-08-15 19:03:08 |
| ddclient | x86_64, arm64 | latest | Network, DNS | v4.0.0-ls206 | 2016-08-29 | 2025-08-12 07:06:28 | |
| deluge | x86_64, arm64 | latest, libtorrentv1 | Downloaders | 2.2.0-r1-ls342 | 2015-10-15 | 2025-08-18 15:50:58 | |
 |
digikam | x86_64 | latest | Photos | 8.7.0-ls267 | 2020-05-20 | 2025-08-14 19:44:38 |
 |
diskover | x86_64, arm64 | latest | Storage, Monitoring | v2.3.2-ls208 | 2018-11-01 | 2025-08-21 11:18:30 |
| dogwalk | x86_64 | latest | Games | ecad6052-ls6 | 2025-07-14 | 2025-08-16 22:51:25 | |
| dokuwiki | x86_64, arm64 | latest | Content Management | 2025-05-14a-ls276 | 2019-05-28 | 2025-08-15 15:54:07 | |
| dolphin | x86_64, arm64 | latest | Games | 370157ed-ls18 | 2025-06-18 | 2025-08-16 23:14:32 | |
| doplarr | x86_64, arm64 | latest | Media Requesters | v3.6.3-ls121 | 2022-01-30 | 2025-08-10 09:05:16 | |
| doublecommander | x86_64, arm64 | latest | Administration, Storage | abfe92cb-ls267 | 2020-03-25 | 2025-08-20 20:02:19 | |
 |
duckdns | x86_64, arm64 | latest | Network, DNS | 992f1854-ls62 | 2016-11-17 | 2025-08-11 04:38:37 |
| duckstation | x86_64, arm64 | latest | Games | latest-ls20 | 2025-06-19 | 2025-08-20 02:40:52 | |
| duplicati | x86_64, arm64 | latest, development | Backup | v2.1.0.5_stable_2025-03-04-ls256 | 2017-04-24 | 2025-08-09 04:16:07 | |
| emby | x86_64, arm64 | latest, beta | Media Servers, Music, Audiobooks | 4.8.11.0-ls251 | 2019-05-30 | 2025-08-07 21:40:10 | |
| fail2ban | x86_64, arm64 | latest | Network, Security | 1.1.0-r2-ls18 | 2022-08-09 | 2025-08-15 07:40:44 | |
| faster-whisper | x86_64, arm64 | latest, gpu | Machine Learning | v2.5.0-ls96 | 2023-11-25 | 2025-08-17 06:55:13 | |
| feed2toot | x86_64, arm64 | latest | RSS, Social | 0.17-ls125 | 2022-11-14 | 2025-08-15 23:39:06 | |
| ferdium | x86_64, arm64 | latest | Chat, Social | v7.1.0-ls96 | 2023-12-07 | 2025-08-14 19:43:46 | |
 |
ffmpeg | x86_64 | latest | Media Tools | 7.1.1-cli-ls39 | 2025-08-07 13:27:15 | |
| filezilla | x86_64, arm64 | latest | FTP | 3.68.1-r0-ls207 | 2021-04-18 | 2025-08-18 19:43:10 | |
| firefox | x86_64, arm64 | latest, kasm | Web Browser | 1142.0build1-1xtradeb1.2404.1-ls24 | 2021-04-19 | 2025-08-20 13:29:59 | |
 |
flexget | x86_64, arm64 | latest | Downloaders | v3.17.13-ls254 | 2023-07-03 | 2025-08-19 16:18:17 |
| flycast | x86_64, arm64 | latest | Games | v2.5-ls16 | 2025-06-19 | 2025-08-14 20:06:47 | |
| foldingathome | x86_64, arm64 | latest | Science | 8.4.9-ls174 | 2020-03-20 | 2025-08-12 03:50:40 | |
| freecad | x86_64, arm64 | latest | 3D Modeling | 1.0.2-ls91 | 2023-12-06 | 2025-08-14 20:34:43 | |
 |
freshrss | x86_64, arm64 | latest | RSS | 1.27.0-ls278 | 2015-08-21 | 2025-08-18 16:52:42 |
| gimp | x86_64, arm64 | latest | Image Editor | 9c6584b7-ls90 | 2023-12-07 | 2025-08-19 06:00:49 | |
| github-desktop | x86_64, arm64 | latest | Programming | release-3.4.13-linux1-ls155 | 2023-04-01 | 2025-08-14 20:24:58 | |
| gitqlient | x86_64, arm64 | latest | Programming | dev-latest-ls95 | 2023-04-02 | 2025-07-24 22:20:13 | |
| grav | x86_64, arm64 | latest | Content Management | 1.7.48-ls218 | 2021-04-09 | 2025-08-09 13:56:48 | |
| grocy | x86_64, arm64 | latest | Recipes | v4.5.0-ls300 | 2018-12-27 | 2025-08-17 07:50:20 | |
| gzdoom | x86_64, arm64 | latest | Games | g4.14.2-ls12 | 2025-07-04 | 2025-08-18 22:05:43 | |
| habridge | x86_64, arm64 | latest | Home Automation | v5.4.1-ls207 | 2018-04-08 | 2025-08-15 22:32:07 | |
| healthchecks | x86_64, arm64 | latest | Monitoring | v3.10-ls305 | 2017-09-27 | 2025-08-11 09:10:52 | |
 |
hedgedoc | x86_64, arm64 | latest | Content Management | 1.10.3-ls167 | 2020-12-22 | 2025-08-13 19:39:43 |
 |
heimdall | x86_64, arm64 | latest, development | Dashboard | v2.7.4-ls319 | 2018-02-12 | 2025-08-15 18:54:55 |
| hishtory-server | x86_64, arm64 | latest | Administration | v0.335-ls125 | 2023-05-19 | 2025-08-15 03:47:05 | |
 |
homeassistant | x86_64, arm64 | latest | Home Automation | 2025.8.2-ls132 | 2021-01-30 | 2025-08-20 02:27:09 |
| htpcmanager | x86_64, arm64 | latest | Media Tools | 26a641bf-ls244 | 2015-09-19 | 2025-08-20 00:01:41 | |
| inkscape | x86_64, arm64 | latest | 3D Modeling | 1.4-r5-ls45 | 2023-12-07 | 2025-08-21 00:14:44 | |
 |
jackett | x86_64, arm64 | latest | Indexers | v0.22.2319-ls129 | 2016-01-25 | 2025-08-21 07:09:03 |
| jellyfin | x86_64, arm64 | latest, nightly | Media Servers, Music, Audiobooks | 10.10.7ubu2404-ls74 | 2019-06-07 | 2025-08-12 13:20:16 | |
| joplin | x86_64 | latest | Content Management | v3.4.6-ls2 | 2025-08-19 | 2025-08-20 20:49:26 | |
| kali-linux | x86_64, arm64 | latest | Remote Desktop, Security | aa96051d-ls59 | 2024-07-18 | 2025-08-18 12:14:39 | |
 |
kasm | x86_64, arm64 | latest | Remote Desktop, Business | 1.17.0-ls90 | 2022-07-02 | 2025-08-19 21:54:48 |
| kavita | x86_64, arm64 | latest | Books | v0.8.7-ls84 | 2023-08-07 | 2025-08-05 09:11:21 | |
| kdenlive | x86_64 | latest | Video Editor | 25.08.0-ls156 | 2022-03-07 | 2025-08-18 14:01:01 | |
| keepassxc | x86_64, arm64 | latest | Password Manager | 2.7.10-r0-ls74 | 2024-04-10 | 2025-08-21 07:15:58 | |
| kicad | x86_64, arm64 | latest | 3D Modeling | 9.0.2-r1-ls89 | 2023-12-06 | 2025-08-19 11:22:16 | |
| kimai | x86_64, arm64 | latest | Finance, Business | 2.38.0-ls129 | 2023-08-09 | 2025-08-15 22:54:26 | |
 |
kometa | x86_64, arm64 | latest, develop, nightly | Media Management | v2.2.1-ls64 | 2024-04-22 | 2025-08-13 20:10:04 |
| krita | x86_64 | latest | Image Editor | 5.2.11-ls89 | 2023-12-07 | 2025-08-14 17:19:22 | |
| lazylibrarian | x86_64, arm64 | latest | Books | e4338a56-ls182 | 2016-09-28 | 2025-08-19 19:11:17 | |
| ldap-auth | x86_64, arm64 | latest | Administration, Security | 3.4.4-ls263 | 2018-08-11 | 2025-08-10 14:05:33 | |
| libreoffice | x86_64, arm64 | latest | Documents | 25.2.5.2-r0-ls151 | 2021-04-05 | 2025-08-18 23:13:57 | |
| librespeed | x86_64, arm64 | latest | Monitoring | 5.4.1-ls241 | 2020-01-09 | 2025-08-17 10:34:01 | |
| librewolf | x86_64, arm64 | latest | Web Browser | 142.0-1-ls84 | 2024-04-09 | 2025-08-20 10:15:00 | |
| lidarr | x86_64, arm64 | latest, develop, nightly | Media Management, Music | 2.12.4.4658-ls50 | 2018-02-23 | 2025-08-20 02:57:50 | |
| limnoria | x86_64, arm64 | latest | IRC | 2025.7.18-ls224 | 2020-01-13 | 2025-08-15 19:02:54 | |
| lollypop | x86_64, arm64 | latest | Music | 1.4.40-r0-ls21 | 2023-04-21 | 2025-08-14 17:13:59 | |
| luanti | x86_64, arm64 | latest | Games | 5.13.0-ls19 | 2025-01-30 | 2025-08-10 21:59:59 | |
| lychee | x86_64, arm64 | latest | Photos | v6.8.1-ls18 | 2017-02-12 | 2025-08-18 13:59:12 | |
| mame | x86_64, arm64 | latest | Games | 0.279dfsg.1-0-ls11 | 2025-07-03 | 2025-08-19 14:59:27 | |
| manyfold | x86_64, arm64 | latest | 3D Printing | v0.122.0-ls100 | 2024-07-23 | 2025-08-20 12:03:12 | |
 |
mariadb | x86_64, arm64 | latest | Databases | 11.4.5-r2-ls191 | 2015-08-12 | 2025-08-12 07:52:47 |
 |
mastodon | x86_64, arm64 | latest, develop, glitch | Social | v4.4.3-ls155 | 2022-11-05 | 2025-08-21 11:06:28 |
| mediaelch | x86_64 | latest | Media Management | 2.12.0.0-1noble-ls87 | 2023-12-07 | 2025-08-16 13:28:38 | |
| medusa | x86_64, arm64 | latest | Media Management | v1.0.22-ls235 | 2017-01-02 | 2025-08-21 15:10:16 | |
| minisatip | x86_64, arm64 | latest | Media Tools | v2.0.25-ls584 | 2016-08-15 | 2025-08-20 23:26:52 | |
| modmanager | x86_64 | latest | Docker | 4e00d3ba-ls21 | 2025-08-10 09:31:20 | ||
| monica | x86_64, arm64 | latest | Content Management | v4.1.2-ls69 | 2024-01-17 | 2025-08-20 08:06:27 | |
| msedge | x86_64 | latest | Web Browser | 139.0.3405.102-1-ls105 | 2024-04-25 | 2025-08-15 19:11:03 | |
| mstream | x86_64, arm64 | latest | Media Servers, Music | v5.13.1-ls207 | 2019-05-18 | 2025-08-13 06:54:54 | |
| mullvad-browser | x86_64 | latest | Web Browser, VPN | 14.5.6-ls133 | 2023-04-03 | 2025-08-21 13:17:54 | |
| mylar3 | x86_64, arm64 | latest, nightly | Books, Media Management | v0.8.3-ls213 | 2020-09-28 | 2025-08-17 06:52:42 | |
| mysql-workbench | x86_64 | latest | Databases | 8.0.43-ls17 | 2020-03-26 | 2025-08-16 07:11:01 | |
| netbox | x86_64, arm64 | latest | Administration, Business | v4.3.6-ls295 | 2020-08-23 | 2025-08-21 15:57:17 | |
| nextcloud | x86_64, arm64 | latest, develop, previous | Cloud, Documents | 31.0.8-ls391 | 2017-03-07 | 2025-08-19 12:03:16 | |
 |
nginx | x86_64, arm64 | latest | Reverse Proxy | 1.28.0-r3-ls329 | 2015-12-05 | 2025-08-21 04:35:12 |
| ngircd | x86_64, arm64 | latest | IRC | 27-r0-ls155 | 2019-07-04 | 2025-08-09 14:58:19 | |
 |
nzbget | x86_64, arm64 | latest, testing | Downloaders | v25.2-ls209 | 2024-05-09 | 2025-08-15 15:47:56 |
| nzbhydra2 | x86_64, arm64 | latest, dev | Indexers | v7.16.0-ls60 | 2018-01-11 | 2025-08-06 22:10:22 | |
| obsidian | x86_64, arm64 | latest | Content Management | v1.9.10-ls80 | 2024-04-06 | 2025-08-18 20:47:36 | |
 |
ombi | x86_64, arm64 | latest, development | Media Requesters | v4.47.1-ls230 | 2017-02-17 | 2025-08-09 22:45:42 |
| onlyoffice | x86_64 | latest | Documents | v9.0.4-ls2 | 2025-08-08 | 2025-08-14 17:53:26 | |
| openshot | x86_64 | latest | Video Editor | v3.3.0-ls29 | 2024-12-23 | 2025-08-15 23:01:42 | |
| openssh-server | x86_64, arm64 | latest | Administration | 10.0_p1-r7-ls202 | 2019-10-17 | 2025-08-10 18:59:02 | |
| openvscode-server | x86_64, arm64 | latest, insiders | Programming | 1.103.1-ls186 | 2021-11-28 | 2025-08-19 07:30:21 | |
| opera | x86_64 | latest | Web Browser | 120.0.5543.161-ls179 | 2023-04-09 | 2025-08-21 02:45:24 | |
| orcaslicer | x86_64 | latest | 3D Printing | v2.3.0-ls95 | 2023-11-15 | 2025-08-19 12:37:55 | |
| oscam | x86_64, arm64 | latest | Media Tools | 11886-ls141 | 2016-09-25 | 2025-08-15 09:23:15 | |
 |
overseerr | x86_64, arm64 | latest, develop | Media Requesters | v1.34.0-ls146 | 2021-04-05 | 2025-08-13 19:04:27 |
 |
pairdrop | x86_64, arm64 | latest | File Sharing | v1.11.2-ls119 | 2023-02-20 | 2025-08-16 12:02:16 |
| pcsx2 | x86_64 | latest | Games | 2.4.0-ls20 | 2025-06-26 | 2025-08-14 17:45:40 | |
| phpmyadmin | x86_64, arm64 | latest | Databases | 5.2.2-ls202 | 2021-06-14 | 2025-08-15 21:42:31 | |
| pidgin | x86_64, arm64 | latest | IRC, Chat | 2.14.14-r0-ls209 | 2021-05-14 | 2025-08-14 17:50:37 | |
| piper | x86_64, arm64 | latest, gpu | Machine Learning | 1.6.3-ls74 | 2023-11-25 | 2025-08-14 08:21:38 | |
 |
piwigo | x86_64, arm64 | latest | Photos | 15.6.0-ls312 | 2015-08-29 | 2025-08-16 15:38:08 |
| planka | x86_64, arm64 | latest | Content Management, Business | v1.26.2-ls28 | 2024-09-12 | 2025-05-09 20:09:09 | |
| plex | x86_64, arm64 | latest | Media Servers, Music, Audiobooks | 1.42.1.10060-4e8b05daf-ls278 | 2015-07-03 | 2025-08-11 17:45:58 | |
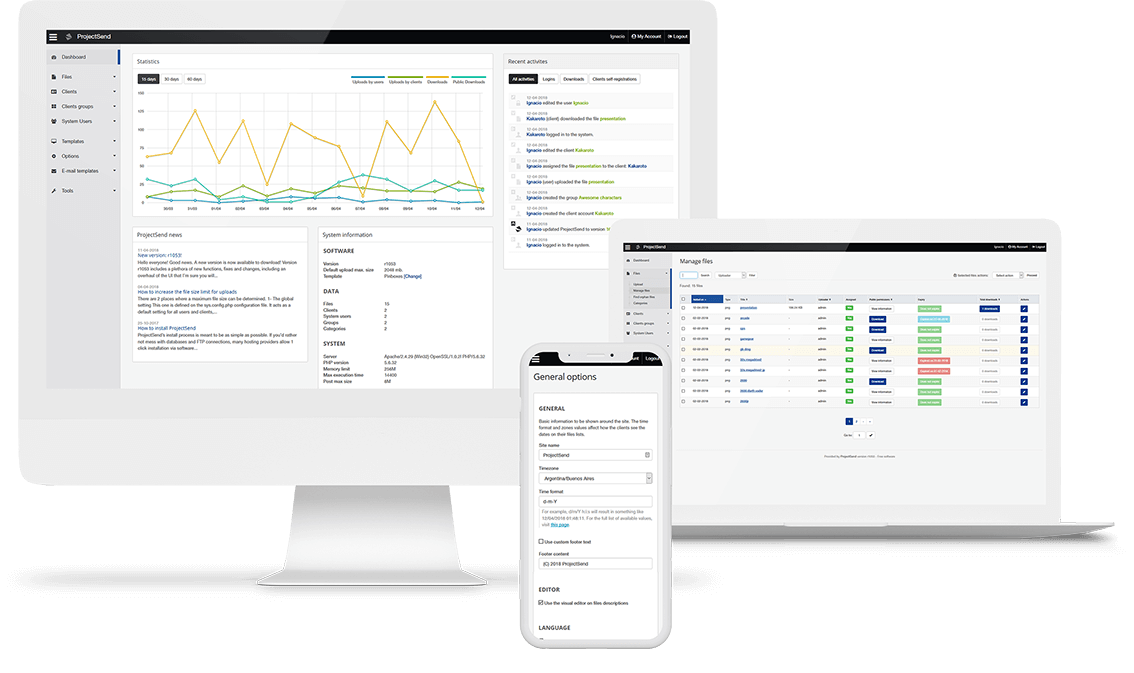 |
projectsend | x86_64, arm64 | latest | File Sharing | r1720-ls241 | 2017-06-13 | 2025-08-18 21:35:27 |
 |
prowlarr | x86_64, arm64 | latest, develop, nightly | Indexers | 1.37.0.5076-ls124 | 2021-06-06 | 2025-08-06 04:41:15 |
| pwndrop | x86_64, arm64 | latest | File Sharing, Security | 1.0.1-ls141 | 2020-04-17 | 2025-08-11 17:02:17 | |
| pydio-cells | x86_64, arm64 | latest | File Sharing | v4.4.15-ls181 | 2019-12-12 | 2025-08-21 03:55:13 | |
| pyload-ng | x86_64, arm64 | latest, develop | Downloaders | 0.5.0b3.dev92-ls189 | 2022-01-24 | 2025-08-21 18:45:45 | |
| qbittorrent | x86_64, arm64 | latest, libtorrentv1 | Downloaders | 5.1.2-r1-ls410 | 2018-02-12 | 2025-08-17 07:05:26 | |
| qdirstat | x86_64, arm64 | latest | Storage | 1.9-ls182 | 2022-01-11 | 2025-08-17 20:52:51 | |
| qemu-static | x86_64 | latest | Docker | 10.0.2ds-2bpo121-ls18 | 2025-08-08 08:50:58 | ||
 |
radarr | x86_64, arm64 | latest, develop, nightly | Media Management | 5.26.2.10099-ls280 | 2017-01-10 | 2025-08-10 17:07:58 |
| raneto | x86_64, arm64 | latest | Content Management | 0.17.8-ls183 | 2019-06-01 | 2025-08-09 21:59:42 | |
| rawtherapee | x86_64 | latest | Image Editor | 5.12-ls45 | 2024-09-24 | 2025-08-17 03:59:36 | |
 |
rdesktop | x86_64, arm64 | 30 tags | Remote Desktop | 048109d8-ls255 | 2020-02-28 | 2025-05-19 00:08:26 |
| remmina | x86_64, arm64 | latest | Remote Desktop | 1.4.35ppa202404261332.recbc3c4eb.da7517dc35ubuntu24.04.1-ls170 | 2020-03-27 | 2025-08-20 14:56:51 | |
| resilio-sync | x86_64, arm64 | latest | Backup | 3.1.0.1073-1-ls221 | 2016-11-02 | 2025-08-11 23:39:46 | |
| retroarch | x86_64, arm64 | latest | Games | 1.21.0ppa1-1ubuntu24.04.1-ls25 | 2025-05-25 | 2025-08-17 15:14:23 | |
| rpcs3 | x86_64, arm64 | latest | Games | build-d72f95677e92fd6031214d20861379ed005207a5-ls25 | 2025-06-19 | 2025-08-21 07:08:55 | |
 |
rsnapshot | x86_64, arm64 | latest | Backup | 1.4.5-r0-ls144 | 2020-08-20 | 2025-08-14 04:58:34 |
| rustdesk | x86_64, arm64 | latest | Remote Desktop | 1.4.1-ls66 | 2024-07-25 | 2025-08-21 16:10:47 | |
 |
sabnzbd | x86_64, arm64 | latest, unstable, nightly | Downloaders | 4.5.2-ls228 | 2015-08-21 | 2025-08-21 02:20:46 |
| shotcut | x86_64 | latest | Video Editor | v25.08.16-ls87 | 2024-01-31 | 2025-08-20 03:45:48 | |
 |
sickgear | x86_64, arm64 | latest, develop | Media Management | release_3.34.1-ls282 | 2018-07-07 | 2025-08-14 22:36:34 |
| smokeping | x86_64, arm64 | latest | Monitoring | 2.9.0-r0-ls145 | 2015-06-29 | 2025-08-19 20:55:09 | |
| socket-proxy | x86_64 | latest | Docker | 3.2.3-r0-ls54 | 2025-08-19 21:24:07 | ||
 |
sonarr | x86_64, arm64 | latest, develop | Media Management | 4.0.15.2941-ls290 | 2015-08-31 | 2025-08-15 23:44:36 |
| speedtest-tracker | x86_64, arm64 | latest | Monitoring | v1.6.6-ls105 | 2024-02-10 | 2025-08-16 21:32:17 | |
| spotube | x86_64, arm64 | latest | Music | v4.0.2-ls73 | 2024-04-26 | 2025-08-15 14:49:34 | |
 |
sqlitebrowser | x86_64, arm64 | latest | Databases | 3.13.1-r0-ls164 | 2020-07-29 | 2025-08-14 18:33:46 |
| steamos | x86_64 | latest | Games | 2025-01-19-ls95 | 2023-07-04 | 2025-01-23 08:56:47 | |
 |
swag | x86_64, arm64 | latest | Reverse Proxy | 4.2.0-ls402 | 2020-08-03 | 2025-08-16 03:55:32 |
 |
synclounge | x86_64, arm64 | latest | Media Tools | 5.2.35-ls129 | 2020-05-11 | 2025-08-19 14:48:49 |
 |
syncthing | x86_64, arm64 | latest | Backup | v2.0.2-ls192 | 2015-09-24 | 2025-08-17 16:52:34 |
| syslog-ng | x86_64, arm64 | latest | Monitoring | 4.8.3-r1-ls166 | 2021-05-26 | 2025-08-14 19:10:45 | |
| tautulli | x86_64, arm64 | latest, develop | Media Tools | v2.15.3-ls199 | 2015-07-16 | 2025-08-14 23:42:21 | |
| thelounge | x86_64, arm64 | latest, next, nightly | IRC, Chat | v4.4.3-ls206 | 2016-08-31 | 2025-08-12 03:56:52 | |
| transmission | x86_64, arm64 | latest | Downloaders | 4.0.6-r4-ls307 | 2015-11-16 | 2025-08-19 10:47:02 | |
 |
tvheadend | x86_64, arm64 | latest | Media Tools | b3974f7d-ls260 | 2016-09-05 | 2025-08-09 15:53:20 |
 |
ubooquity | x86_64, arm64 | latest | Books | 3.1.0-ls64 | 2016-12-06 | 2025-08-18 19:45:10 |
| ungoogled-chromium | x86_64 | latest | Web Browser | 139.0.7258.127-1-ls82 | 2024-07-25 | 2025-08-19 03:30:13 | |
 |
unifi-network-application | x86_64, arm64 | latest | Network | 9.3.45-ls100 | 2023-09-05 | 2025-08-12 17:41:56 |
| vscodium | x86_64, arm64 | latest | Programming | 1.103.15539-ls209 | 2023-04-02 | 2025-08-20 04:57:21 | |
| webcord | x86_64, arm64 | latest | Chat | v4.11.0-ls146 | 2023-04-21 | 2025-08-19 12:43:36 | |
 |
webgrabplus | x86_64, arm64 | latest | Media Tools | 5.3.1-ls271 | 2018-01-18 | 2025-08-14 08:52:18 |
| webtop | x86_64, arm64 | 22 tags | Remote Desktop | 62727118-ls249 | 2021-04-20 | 2025-08-20 13:30:24 | |
| wikijs | x86_64, arm64 | latest | Content Management | v2.5.308-ls191 | 2019-12-14 | 2025-08-13 07:51:56 | |
 |
wireguard | x86_64, arm64 | latest | Network, VPN | 1.0.20250521-r0-ls82 | 2020-03-31 | 2025-08-14 11:33:38 |
| wireshark | x86_64, arm64 | latest | Network | 4.4.7-r0-ls268 | 2020-03-31 | 2025-08-14 18:37:56 | |
| wps-office | x86_64 | latest | Documents | 11.1.0.11723-ls125 | 2023-04-21 | 2025-08-14 19:20:12 | |
 |
xbackbone | x86_64, arm64 | latest | File Sharing | 3.8.1-ls196 | 2021-06-06 | 2025-08-17 03:44:33 |
| xemu | x86_64, arm64 | latest | Games | v0.8.96-ls20 | 2025-06-19 | 2025-08-18 20:51:03 | |
| yaak | x86_64 | latest | Programming | v2025.5.6-ls74 | 2024-09-12 | 2025-08-19 04:57:19 | |
| your_spotify | x86_64, arm64 | latest | Music | 1.14.0-ls128 | 2023-01-23 | 2025-08-20 19:21:17 | |
| zen | x86_64, arm64 | latest | Web Browser | 1.14.11b-ls1 | 2025-08-19 | 2025-08-19 20:27:06 | |
| znc | x86_64, arm64 | latest | IRC | znc-1.10.1-ls165 | 2015-12-11 | 2025-08-15 03:49:17 | |
| zotero | x86_64 | latest | Documents | 7.0.23-ls91 | 2024-01-31 | 2025-08-14 18:40:23 |
Docker Swarm
Docker Swarm vs Kubernetes: A Practical Comparison
Contents
In the world of container orchestration, two prominent platforms have emerged as leaders: Docker Swarm and Kubernete. As organizations increasingly adopt containerization to achieve scalability, resilience, and efficient resource utilization, choosing between these two solutions becomes crucial.
This article will compare both platforms, exploring their features, strengths, and trade-offs. By understanding their differences and use cases, you will gain valuable insights to select the ideal container orchestration tool for your specific needs.
We will examine various aspects, including installation and setup, container compatibility, scalability, high availability, networking, ease of use, ecosystem, and security. Through practical hands-on example, you will get a taste of how each platform tackles common challenges in deploying and managing containerized applications.
Whether you are new to container orchestration or seeking to transition from one platform to another, this article aims to provide comprehensive knowledge to make an educated choice. By the end, you be well-equipped to decide which option aligns best with your requirements and goals.
Without any further ado, let's learn what Docker Swarm is first.
What is Docker Swarm?
Docker Swarm is a container orchestration tool for managing and deploying applications using a containerization approach. It allows you to create a cluster of Docker nodes (known as a Swarm) and deploy services to the cluster. Docker Swarm is lightweight and straightforward, allowing you to containerize and deploy your software project in minutes.
To manage and deploy applications efficiently, Docker Swarm offers the following capabilities:
- Cluster Management: You can create a cluster of nodes to manage the application containers. A node can be a manager or a worker (or both).
- Service Abstraction: Docker Swarm introduces the "Service" component, which lets you set the network configurations, resource limits, and number of container replicas. By managing the services, Docker Swarm ensures the application's desired state is maintained,
- Load Balancing: Swarm offers built-in load balancing, which allows services inside the cluster to interact without the need for you to define the load balancer file manually.
- Rolling Back: Rolling back to a specific service to its previous version is fully supported in case of a failed deployment.
- Fault Tolerance: Docker Swarm automatically checks for failures in nodes and containers to generate new ones to allow users to keep using the application without noticing any problems.
- Scalability: With Docker Swarm, you have the flexibility to adjust the number of replicas for your containers easily. This allows you to scale your application up or down based on the changing demands of your workload.
Docker Swarm architecture
Below is the diagram representing Docker Swarm Architecture:
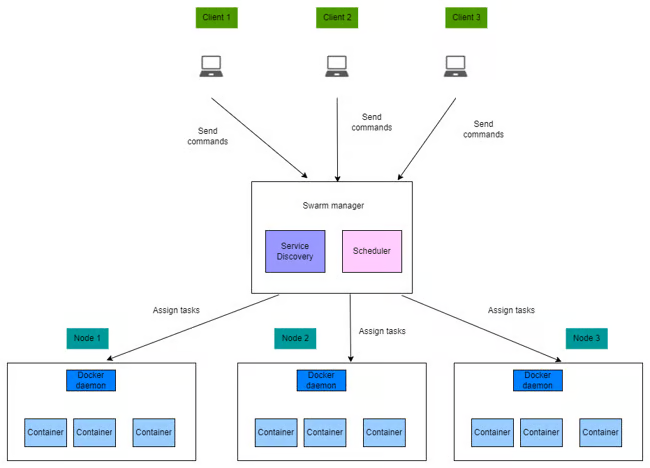
In summary, the Swarm cluster consists of several vital components that work together to manage and deploy containers efficiently:
-
Manager nodes are responsible for receiving client commands and assigning tasks to worker nodes. Inside each manager node, we have the Service Discovery and Scheduler component. The former is responsible for collecting information on the worker nodes, while the latter finds suitable worker nodes to assign tasks to.
-
Worker nodes are solely responsible for executing the tasks assigned by a manager node.
In the above diagram, the deployment steps typically work like this:
- The client machines send commands to a manager node, let's say to deploy a new PostgreSQL database to the Swarm cluster.
- The Swarm manager finds the appropriate worker node to assign tasks for creating the new deployment.
- Finally, the worker node will create new containers for the PostgreSQL database and manage the containers' states.
Now that you've understood what Docker Swarm is and how it works let's learn about Kubernetes.
What is Kubernetes?
Kubernetes is a container orchestration tool for managing and deploying containerized applications. It supports a wide variety of container runtimes, including Docker, Containerd, Mirantis, and others, but the most commonly used runtime is Docker. Kubernetes is feature-rich and highly configurable, which makes it ideal for deploying complex applications, but it requires a steep learning curve.
Some of the key features of Kubernetes are listed below:
- Container Orchestration with Pods: A pod is the smallest and simplest deployment unit. Kubernetes allows you to deploy applications by creating and managing one or more containers in pods.
- Service Discovery: Kubernetes allows containers to interact with each other easily within the same cluster.
- Load Balancing: Kubernetes' load balancer allows access to a group of pods via an external network. Clients from outside the Kubernetes cluster can access the pods running inside the Kubernetes cluster via the balancer's external IP. If any of the pods in the group goes down, client requests will automatically be forwarded to other pods, allowing the deployed applications to be highly available.
- Automatic Scaling: You can scale-in or scale-out your application by adjusting number of deployed containers based on resource utilization or custom-defined metrics.
- Self-Healing: If one of your pods goes down, Kubernetes will try to recreate that pod automatically so that normal operation is restored.
- Persistent Storage: It provides support for various storage options, allowing you to persist data beyond the lifecycle of individual pods.
- Configuration and Secrets Management: Kubernetes allows you to store and manage configuration data and secrets securely, decoupling sensitive information from the application code.
- Rolling back: If there's a problem with your deployment, you can easily transition to a previous version of the application.
- Resource Management: With Kubernetes, you can flexibly set the resource constraints when deploying your application.
- Extensibility: Kubernetes has a vast ecosystem and can be extended with numerous plugins and tools for added functionality. You can also interact with Kubernetes components using Kubernetes APIs to deploy your application programmatically.
Kubernetes architecture
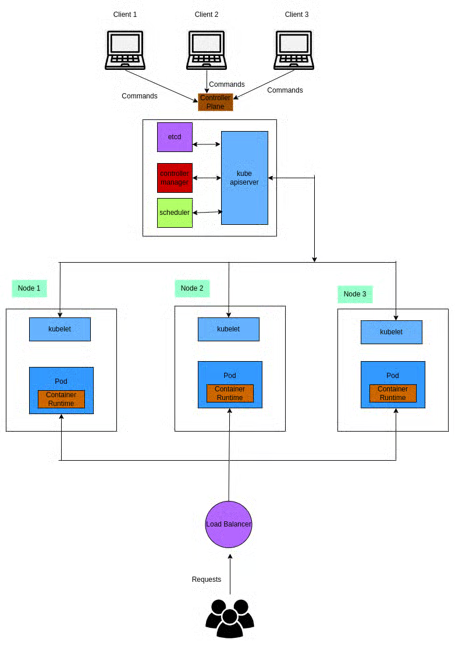
The above diagram illustrates the Kubernetes architecture. It contains the following components:
- Control Plane: This is a set of components responsible for managing the operation of a Kubernetes cluster. The main components of the Kubernetes control plane are:
- Kube API Server: Provides an interface to interact with the Kubernetes cluster. It exposes the Kubernetes API so that clients from outside the cluster can communicate and control it.
- Etcd: It is a distributed key-value store for storing configuration data and the desired state of the cluster.
- Scheduler: It decides where to place newly created pods within the cluster based on resource requirements, node availability, and other defined rules. It also continuously monitors the cluster's resources to balance the workload across nodes.
- Kube Controller Manager: It is responsible for managing and maintaining the desired state of various Kubernetes components such as pods, services, or volumes. It continuously checks the state of Kubernetes components, whether they match expectations or not. If they don't, the controller-manager will take action to restore order to the problematic components.
-
Kubernetes node: The Kubernetes node (which could be a physical or virtual machine) is responsible for executing the tasks assigned by the control plane. Here are the main components and concepts related to Kubernetes' nodes:
- Kubelet: The Kubelet is an agent that runs on each node and manages the containers and their lifecycle. It communicates with the control plane, receives instructions about which containers to run, and ensures that the containers are in the desired state. The Kubelet also monitors the health of the containers and reports their status back to the control plane.
- Pod: Kubernetes pod is the smallest component of Kubernetes cluster. It represents a single instance of a running process in the cluster. Inside a pod you have the container runtime, which is responsible for pulling container images from a registry, creating container instances, and managing their execution.
In the Kubernetes architecture diagram above, the execution steps work like this:
- The client from outside the Kubernetes cluster will interact with the cluster by executing
kubectlcommand to the Kubernetes controller plane. - The controller plane will assign deployment tasks to the Kubernetes Node.
- The Kubernetes node will create new pods with container runtime for the container execution.
- To allow users outside the cluster to interact with the deployed app, the client sends requests to the Kubernetes control plane to create a load balancer.
- Finally, users can interact with the deployed application via the load balancer IP Address.
Now that you understand what Kubernetes is, let's continue to the next section to learn the differences between Docker Swarm and Kubernetes.
Comparing Docker Swarm and Kubernetes
Although Docker Swarm and Kubernetes offer the capabilities to orchestrate containers, they are fundamentally different and serve different use cases.
| Criteria | Docker Swarm | Kubernetes |
|---|---|---|
| Installation and setup | Easy to set up using the docker command |
Complicated to manually set up the Kubernetes cluster |
| Types of containers they support | Only works with Docker containers | Supports Containerd, Docker, CRI-O, and others |
| High Availability | Provides basic configuration to support high availability | Offers feature-rich support for high availability |
| Popularity | Popular | Popular |
| Networking | Support basic networking features | Advanced features support for networking |
| GUI support | Yes | Yes |
| Learning curve | Easy to get started | Requires a steeper learning curve |
| Complexity | Simple and lightweight | Complicated and offer a lot of features |
| Load balancing | Automatic load-balancing | Manual load-balancing |
| CLIs | Do not need to install other CLI | Need to install other CLIs such as kubectl |
| Scalability | Does not support automatic scaling | Supports automatic scaling |
| Security | Only supports TLS | Supports RBAC, SSL/TLS, and secret management |
Setup and installation
Regarding installation and setup, Docker Swarm is easier to set up than Kubernetes. Assuming Docker is already installed, you only need to run docker swarm init to create the cluster, then attach a node to the cluster using docker swarm join.
The steps for setting up a Kubernetes cluster are not as straightforward without using cloud platforms. However, there are some tools ease the process such as Kubeadm, or Kubespray. For example, to create a new cluster using Kubeadm you need to:
- Set up the Docker runtime on all the nodes.
- Install Kubeadm on all the nodes.
- Initiate Kubernetes Control Plane on the master node.
- Install the network plugin.
- Join the worker node to the master node.
- Using
kubectl get nodeto check whether all the nodes are added to the Kubernetes cluster.
Types of containers they support
Docker Swarm only supports Docker containers, but Kubernetes supports any container runtime that implements its Container Runtime Interface, including Docker, Containerd, CRI-O, Mirantis, and others, giving you many options to choose the one that best fits your use cases.
High availability
Docker Swarm provides built-in high availability for services. It automatically replicates services across multiple nodes in the Swarm cluster, ensuring that containers are distributed and balanced for fault tolerance.
On the other hand, Kubernetes provides a comprehensive set of features to achieve high availability, such as advanced scheduling to define pod placement based on node availability or resource utilization. Factors such as node health, resource constraints, and workload demands are also considered when distributing pods across the cluster.
Popularity
Both Docker Swarm and Kubernetes are popular in the industry and have been battle-tested for a wide variety of use cases. Docker Swarm is often used where simplicity and fast deployment are the primary considerations, while Kubernetes is well-suited for complex applications that demand advanced features and capabilities. It excels in scenarios where high availability, scalability, and flexibility are crucial requirements.
Networking
Both Docker Swarm and Kubernetes offer networking support. Docker Swarm provides simpler built-in overlay networking capabilities, while Kubernetes supports a more extensive and flexible networking model through its wide range of plugins and advanced networking features.
GUI support
Both Docker Swarm and Kubernetes have GUI tools to help you easily interact with them. With Docker Swarm, you have Swarmpit or Shipyard. For Kubernetes, you have Kubernetes Lens, Kube-dashboard, or Octant.
Learning curve
Docker Swarm is easy to learn and start with since it is lightweight and provides a simple approach to managing Docker containers. Kubernetes, however, has a much steeper learning curve since it offers more features and flexibility for deploying and managing containers.
Complexity
Docker Swarm is designed to be lightweight and easy to use while Kubernetes is designed to have a lot of features and support to deploy complex applications. Thus, Kubernetes is much more complicated to operate compared to Docker Swarm.
Load Balancing
Docker Swarm offers an automatic load balancing mechanism, ensuring seamless communication and interaction between containers within the Docker Swarm cluster. The load balancing functionality is built-in, requiring minimal configuration.
In contrast, Kubernetes provides a more customizable approach to load balancing. It allows you to define and configure load balancers based on your specific requirements. While this requires some manual setup, it grants you greater control over the load balancing configuration within the Kubernetes cluster.
Command-line tools
When working with Docker Swarm, there is no need to install an additional command line tool specifically for cluster management. The standard docker command is sufficient to create and interact with the Swarm cluster.
However, Kubernetes requires the installation of the kubectl command line tool to work with the cluster. kubectl is the primary way to interact with a Kubernetes cluster and it provides extensive functionality for managing deployments, services, pods, and other resources within the Kubernetes environment.
Scalability
Kubernetes allows you to automatically scale in or scale out the containers based on resource utilization or other factors. Docker Swarm, on the other hand, does not support auto-scaling ability.
Security
Docker Swarm and Kubernetes were built with security in mind, and they both provide several features and mechanisms to deploy applications safely. However, Kubernetes supports more authentication and authorization mechanisms such as Role-Based Access Control (RBAC), secure access layers (SSL), TLS protocol, and secret management.
Now that you have a clearer understanding of the distinctions between Docker Swarm and Kubernetes, we will now focus on deploying a sample Go application to both platforms. This hands-on experience will provide you with practical insights into the deployment process, showcasing the unique features and considerations of each platform.
Prerequisites
Before following through with the rest of this tutorial, you need to meet the following requirements:
- A ready-to-use Linux machine, such as an Ubuntu version 22.04 server.
- A recent version of Go installed on your machine.
- A ready-to-use Git command line for cloning the sample application from its GitHub repo.
- A recent version of Docker installed and accessible without using
sudo. - A free DockerHub account for storing and sharing Docker images.
- An already installed PostgreSQL instance.
Setting up the demo application
To fully understand how Docker Swarm and Kubernetes work and how they differ, you will deploy a demo application using both tools. This application is a blog service that allows users to create, update, retrieve, and delete blog posts. It is built using the Go programming language, and its data is stored in PostgreSQL.
However, you don't need to be familiar with Go or PostgreSQL to follow through. If you prefer, you can use an application stack that you're more familiar with and just follow the deployment steps to practice using Docker Swarm and Kubernetes.
To test out the application's functionality, let's try to run it directly on the local machine before deploying it through Docker Swarm and Kubernetes.
1. Cloning the GitHub repository
In this step, you will clone the this GitHub repository to your machine using the commands below:
git clone https://github.com/betterstack-community/docker-swarm-kubernetes
cd betterstack-swarm-kubernetes
The structure of the directory should look like this:
├── config
├── Dockerfile
├── go.mod
├── go.sum
├── handler
├── kubernetes
├── main.go
└── swarm
- The
swarmandkubernetesdirectories, along with theDockerfilefile are for deploying the app to Docker Swarm and Kubernetes platform. You will temporarily skip them for now. - The rest of the directories and files constitute the Go application.
2. Creating a PostgreSQL database in the local environment
Assuming PostgreSQL is installed on your machine, you can go ahead and access the psql command-line using the default postgres user by running the following command:
sudo -u postgres psql
In the psql interface, create a new user named "blog_user":
CREATE USER blog_user;
Run the following command to list all existing users in the PostgreSQL database. You should see the blog_user user there.
\du
                                   List of roles
 Role name |                         Attributes                         | Member of
-----------+------------------------------------------------------------+-----------
 blog_user      |                                                         | {}
 postgres  | Superuser, Create role, Create DB, Replication, Bypass RLS | {}
Next, change the password of the blog_user user to "blog_password":
ALTER ROLE blog_user WITH PASSWORD 'blog_password';
Afterward, create a new blog_db database by running the following command:
CREATE DATABASE blog_db;
Finally, quit the current session using \q, and then log in again to blog_db database using blog_user user. Enter the password for the blog user if prompted:
psql -U blog_user -d blog_db -h localhost
At this stage, you can create a new posts table within the blog_db database by running the following command:
CREATE TABLE IF NOT EXISTS posts (
   ID         SERIAL NOT NULL PRIMARY KEY,
   BODY       TEXT   NOT NULL,
   CREATED_AT TIMESTAMP DEFAULT CURRENT_TIMESTAMP,
   UPDATED_AT TIMESTAMP DEFAULT CURRENT_TIMESTAMP
);
Now that you've successfully set up the database let's go ahead and run the application in the local environment.
3. Starting the application
To bring up the app in the local environment, you need to install the required dependencies first:
go mod tidy
Then run the following commands to set the necessary environment variables for the Go application to access the PostgreSQL database:
export POSTGRES_PASSWORD=blog_password
export POSTGRES_DB=blog_db
export POSTGRES_USER=blog_user
export POSTGRES_HOST=localhost
Afterward, run the following command to start the Go application:
go run main.go
You are connected to the database
Once the application is up and running open a separate terminal and run the following command to create a new blog entry:
curl --location 'http://localhost:8081/blog' \
    --header 'Content-Type: application/json' \
    --data '{
        "body":"this is a great blog"
    }'
Then run the following command to get the entry with an id of 1:
curl --location 'http://localhost:8081/blog/1'
You should see the result below:
{"id":1,"body":"this is a great blog","created_at":"2023-05-13T15:03:40.461732Z","updated_at":"2023-05-13T15:03:40.461732Z"}
At this point, you've successfully set up the app in the local environment and interacted with its APIs to confirm that it's in working order. Let's now move on to the next section where you will deploy the application using Docker Swarm.
Deploying the application with Docker Swarm
Since you no longer need the PostgreSQL database service to run, you can stop it by running the following command:
sudo service postgresql stop
You can also stop the current application by pressing CTRL+C in the terminal.
1. Create a Docker Swarm cluster
In a Docker Swarm cluster, you will have one or more manager nodes to distribute tasks to one or more worker nodes. To simplify this demonstration, you will only create the manger node responsible for deploying the services and handling the application workload.
To create a Docker Swarm cluster, run the following command:
docker swarm init
You should see the following output confirming that the current node is a manager and relevant instructions to add a worker node to the cluster:
Swarm initialized: current node (rpuk92y8wypwqwnv5kqzk5fik) is now a manager.

To add a worker to this swarm, run the following command:

    docker swarm join --token <token> <ip_address>

To add a manager to this swarm, run 'docker swarm join-token manager' and follow the instructions.
Since we won't be adding a worker node to the Swarm cluster, let's move on to the next section and push the Docker image to DockerHub. If you'd like to see a full demonstration of running a highly available Docker Swarm setup in production, please see the linked article.
2. Building the application Docker image
Inside the application directory, you have a Dockerfile which has the following contents:
FROM golang:1.20

WORKDIR /app
COPY go.mod go.sum ./
RUN go mod download
COPY main.go ./
COPY config/db.go ./config/db.go
COPY handler/handlers.go ./handler/handlers.go
RUN CGO_ENABLED=0 GOOS=linux go build -o /out/main ./
EXPOSE 8081

# Run
ENTRYPOINT ["/out/main"]
These commands inside the Dockerfile instructs Docker to pull the Go version 1.20 image, then copy the files from our project directory into the Docker image and build an application executable named main in the /out directory. It also specifies that the Docker container will listen on port 8081 and that the /out/main binary is executed when the container is started.
To build the application image, run the following command. Remember to replace the <username> placeholder with your DockerHub username:
docker build -t <username>/blog .
You should observe the following output at the end of the process:
. . .
Successfully built 222ca8bc81b8
Successfully tagged <username>/blog:latest
Now that you have successfully built the application image, log into your DockerHub account from the current session so that you can push the image to your account:
docker login
WARNING! Your password will be stored unencrypted in /home/<user>/.docker/config.json.
Configure a credential helper to remove this warning. See
https://docs.docker.com/engine/reference/commandline/login/#credentials-store

Login Succeeded
Once login is successful, run the following command to push the image to DockerHub:
docker push <username>/blog
Now that you've successfully pushed the image to your DockerHub account, let's move on to the next section and deploy the application to the Swarm cluster.
3. Deploying the application to the Swarm cluster
In this section, you will deploy the Go application and the PostgreSQL database to the Swarm cluster. Within the swarm directory, you have the two following files:
initdb.sqlis for initializing the database state by creating a new table named "posts" when deploying the PostgreSQL database to the Swarm clusterdocker-compose.ymlis for creating the PostgreSQL database and the application services to the Swarm cluster
Open the docker-compose.yml file in your text editor and update the <username> placeholder to your Docker username:
# Use postgres/example user/password credentials
version: '3.6'

services:
  db:
    image: postgres
    environment:
      - POSTGRES_DB=blog_db
      - POSTGRES_USER=blog_user
      - POSTGRES_PASSWORD=blog_password
    ports:
      - '5432:5432'
    volumes:
      - ./initdb.sql:/docker-entrypoint-initdb.d/initdb.sql
    networks:
      - blog-network

  blog:
    environment:
      - POSTGRES_DB=blog_db
      - POSTGRES_USER=blog_user
      - POSTGRES_PASSWORD=blog_password
      - POSTGRES_HOST=db:5432
    ports:
      - '8081:8081'
    volumes:
      - .:/app
    networks:
      - blog-network

networks:
  blog-network:
    name: blog-network
This file instructs Docker Swarm to create three services called db, blog, and networks:
- The
dbservice is for creating a PostgreSQL database using the specified configuration. Its state is initialized using theinitdb.sqlfile, and it uses theblog-networknetwork. - The
blogservice creates the blog application using the Docker image you previously pushed to DockerHub. You also need to provide environment variables for this service so that the application can access the PostgreSQL database. This service will also use theblog-networknetwork allowing interaction with thedbservice through the host URL:db:5432. - The
networksservice creates a network namedblog-networkso the two services can communicate via this network.
To deploy these three services to the running Swarm cluster, run the following commands in turn:
cd swarm
docker stack deploy --compose-file docker-compose.yml blogapp
Creating network blog-network
Creating service blogapp_db
Creating service blogapp_blog
Afterward, run the following command to verify that the services are running:
docker stack services blogapp
You should see the following results:
ID             NAME           MODE         REPLICAS   IMAGE                  PORTS
uptqkx630zpy   blogapp_blog   replicated   1/1        username/blog:latest   *:8081->8081/tcp
jgb19lcx32y6   blogapp_db     replicated   1/1        postgres:latest        *:5432->5432/tcp
You should also be able to interact with the application endpoints now. Run the following command to create a new blog post:
curl --location 'http://localhost:8081/blog' \
    --header 'Content-Type: application/json' \
    --data '{
        "body":"this is a great blog"
    }'
Then run the command below to retrieve the newly created post:
curl --location 'http://localhost:8081/blog/1'
You should observe the same output as before:
{"id":1,"body":"this is a great blog","created_at":"2023-05-13T08:56:26.140815Z","updated_at":"2023-05-13T08:56:26.140815Z"}
Now that you've successfully deployed the blog application using Docker Swarm. Let's move on to the next section and learn how to deploy the application using Kubernetes.
Deploying the application with Kubernetes
To simplify the setup for the Kubernetes cluster, you will use the minikube tool which allows you to create an run a local Kubernetes cluster on your machine.
Start by following these instructions to install the minikube binary on your machine, then launch the minikube service by running the following command:
minikube start
Afterwards, run the following command to check whether the minikube service is up and running:
minikube kubectl -- get node
You should see the output below:
NAME       STATUS   ROLES           AGE    VERSION
minikube   Ready    control-plane   188d   v1.25.3
For ease of use, you should alias the minukube kubectl -- command to kubectl as follows:
alias kubectl="minikube kubectl --"
Now that the minikube service is up and running, you will can proceed with deploying the Go application and PostgreSQL database to the Kubernetes cluster. Let's start by deploying the PostgreSQL database in the next section.
1. Deploying the PostgreSQL database to the Kubernetes cluster
To deploy the PostgreSQL database to the Kubernetes cluster, you need to:
- Create a Kubernetes Persistent Volume (Kubernetes PV) so that you don't lose the application data when the Kubernetes cluster is down.
- Create the Kubernetes Persistent Volume Claim (Kubernetes PVC) to request storage inside the Kubernetes PV.
- Create the Kubernetes Config Map with initializing SQL query to create a table named
postswhen deploying the PostgreSQL database. - Create the Kubernetes Deployment to deploy the PostgreSQL database to the Kubernetes cluster.
- Create the Kubernetes Service, which allows the blog application to access to the PostgreSQL database.
From the current terminal, navigate to the kubernetes directory:
cd ../kubernetes
Next, create a postgres/docker-pg-vol/data directory inside the kubernetes directory to store the persistent data:
mkdir postgres/docker-pg-vol/data -p
Update the path inside the hostPath block in the postgres-volume.yml file with the absolute path to the persistent data directory. The path should look like this: /home/<username>/betterstack-swarm-kubernetes/kubernetes/postgres/docker-pg-vol/data
nano postgres-volume.yml
apiVersion: v1
kind: PersistentVolume
metadata:
  name: postgresql-claim0
  labels:
    type: local
spec:
  storageClassName: manual
  capacity:
    storage: 1Gi
  accessModes:
    - ReadWriteOnce
  hostPath:
Afterward, run the following command to create the Kubernetes Persistent Volume. If you do not specify the --namespace value, Kubernetes will automatically use the default namespace.
kubectl apply -f postgres-volume.yml
persistentvolume/postgresql-claim0 created
Then run the following command to create the Persistent Volume Claim.
kubectl apply -f postgres-pvc.yml
persistentvolumeclaim/postgresql-claim0 created
To create the configuration map for initializing the SQL query, run the following command:
kubectl apply -f postgres-initdb-config.yml
configmap/postgresql-initdb-config created
Next, run the following command to deploy the PostgreSQL database:
kubectl apply -f postgres-deployment.yml
deployment.apps/postgresql created
Finally, create the Kubernetes service for the PostgreSQL database:
kubectl apply -f postgres-service.yml
service/postgresql created
At this point, the PostgreSQL instance should be up and running. Go ahead and run the command below to confirm:
kubectl get pod
You should see the following result:
NAME                               READY   STATUS    RESTARTS        AGE
postgresql-655746b9f8-n4dcf        1/1     Running   0               2m36s
Run the following command to check for the PostgreSQL service.
kubectl get service
You should see the following output:
NAME         TYPE        CLUSTER-IP      EXTERNAL-IP   PORT(S)    AGE
kubernetes   ClusterIP   10.96.0.1       <none>        443/TCP    14d
postgresql   ClusterIP   10.98.157.228   <none>        5432/TCP   2s
Now that you've successfully deployed the PostgreSQL database to the Kubernetes cluster, let's deploy the blog application next.
2. Deploying the application to the Kubernetes cluster
Before you can deploy your application using Kubernetes, you need to create a Docker secret so that Kubernetes can access your DockerHub account to pull the application image. Note that you need to replace the username, password, and email below with your DockerHub account information:
kubectl create secret docker-registry dockerhub-secret \
  --docker-server=docker.io \
  --docker-username=<username> \
  --docker-password=<password> \
  --docker-email=<email>
secret/dockerhub-secret created
Once the secret is created, open the deployment.yml file in your text editor and edit it as follows:
nano kubernetes/deployment.yml
---
apiVersion: apps/v1
kind: Deployment
metadata:
  name: blogapp
spec:
  replicas: 2
  selector:
    matchLabels:
      name: blogapp
  template:
    metadata:
      labels:
        name: blogapp
    spec:
      containers:
        - name: application
          imagePullPolicy: Always
          envFrom:
            - secretRef:
                name: dockerhub-secret
          env:
            - name: POSTGRES_DB
              value: blog_db
            - name: POSTGRES_USER
              value: blog_user
            - name: POSTGRES_PASSWORD
              value: blog_password
            - name: POSTGRES_HOST
              value: postgresql:5432
          ports:
            - containerPort: 8081
Save and close the file, then run the following command to deploy the blog app:
kubectl apply -f deployment.yml
deployment.apps/blogapp created
Then run the following command to create the Kubernetes service for the blog app, so that you can access the app from outside the Kubernetes cluster.
kubectl apply -f service.yml
service/blogapp-service created
Run the following command to get the running services inside the Kubernetes cluster.
kubectl get service
You should see the following result:
NAME              TYPE           CLUSTER-IP     EXTERNAL-IP   PORT(S)          AGE
blogapp-service   LoadBalancer   10.97.173.87   <pending>     8081:31983/TCP   5s
kubernetes        ClusterIP      10.96.0.1      <none>        443/TCP          14d
postgresql        ClusterIP      10.96.38.7     <none>        5432/TCP         8m1s
Notice that the EXTERNAL-IP column for the blogapp-service is pending. This is because you are using a custom Kubernetes cluster (minikube) that does not have an integrated load balancer. To workaround this issue, create a minikube tunnel in a new terminal through the command below:
minikube tunnel
Then run the kubectl get service command again. You should see the updated result with a proper EXTERNAL-IP value:
NAME              TYPE           CLUSTER-IP     EXTERNAL-IP    PORT(S)          AGE
blogapp-service   LoadBalancer   10.97.173.87   10.97.173.87   8081:31983/TCP   4m40s
kubernetes        ClusterIP      10.96.0.1      <none>         443/TCP          14d
postgresql        ClusterIP      10.96.38.7     <none>         5432/TCP         12m
Now that you've deployed the blog application to the Kubernetes cluster, you can access it through its external IP which in the above example is 10.97.173.87.
curl --location 'http://<external_ip>:8081/blog' \
    --header 'Content-Type: application/json' \
    --data '{
        "body":"this is a great blog"
    }'
Then run the following command to get the blog content with id 1.
curl --location 'http://<external_ip>:8081/blog/1'
You should see the output as:
{"id":1,"body":"this is a great blog","created_at":"2023-05-13T08:56:26.140815Z","updated_at":"2023-05-13T08:56:26.140815Z"}
And that's how you deploy the blog application to the Kubernetes cluster.
Comparing the deployment process between Docker Swarm and Kubernetes, we observe distinct trade-offs. Docker Swarm offers a simpler deployment experience, but it lacks built-in support for persistent data storage. In the event of a Docker Swarm cluster failure or recreation, there is a risk of losing the application data.
In contrast, Kubernetes introduces a more intricate deployment process but it offers the advantage of creating persistent data storage, ensuring data durability even during cluster disruptions or recreation. Additionally, Kubernetes provides flexibility in exposing the blog app service as per your requirements by leveraging the Kubernetes Service definition file.
Use cases of Kubernetes vs. Docker Swarm
Docker Swarm and Kubernetes, despite being container orchestration platforms, possess distinct characteristics that cater to different use cases.
Docker Swarm is well-suited for:
- Beginners in containerization who seek to learn application deployment using containerization techniques.
- Small to medium-sized applications that require straightforward deployment and management.
- Users familiar with Docker and prefer a Docker-centric approach to application deployment. Docker Swarm seamlessly integrates with the Docker ecosystem.
- Applications with a relatively stable user base or predictable traffic patterns. Docker Swarm, although lacking advanced automatic scaling features compared to Kubernetes, can adequately handle such scenarios.
Kubernetes should be considered when:
- You have a comprehensive understanding of Kubernetes components and have acquired proficiency in working with the platform. Kubernetes has a steeper learning curve but offers a comprehensive solution for deploying and managing containerized applications.
- Your application is complex and demands extensive customization during deployment. Kubernetes excels in managing large-scale, intricate applications, providing advanced management, scalability, and customization capabilities.
- Fine-grained control and customization options are crucial for your deployment.
- Automatic scaling is necessary due to your application's growing user base.
In summary, Docker Swarm suits simpler deployments and those who prefer a Docker-centric approach, while Kubernetes caters to complex applications, fine-grained control, and automatic scaling needs. Carefully assess your requirements and familiarity with the platforms to determine the most suitable choice for your specific use case.
Final thoughts
Throughout this article, you've gained insights into the distinctions between Docker Swarm and Kubernetes, and you've also had practical experience deploying a sample Go application using both platforms.
To further explore technical articles on cloud-native and containerization technologies, we invite you to visit our BetterStack community guides. There, you can find additional resources and in-depth information to enhance your understanding of these technologies.
Thanks for reading!
How to Scale Docker Swarm Horizontally in Production
Link: https://betterstack.com/community/guides/scaling-docker/horizontally-scaling-swarm/
Contents
With any software service deployment, there might come a time when you need to think about scaling your service due to meet changing demands. Such an action may be triggered by multiple factors including the following:
- Your service is under heavy load which can ultimately impact its performance. Therefore, you'll want to add more instances of the service throughout the cluster, such that the incoming load can be re-distributed evenly.
- Your service does not have enough instances running throughout multiple availability zones of your cluster. This means it might be subject to a single point of failure which compromises its availability if one or more nodes in the cluster go down. Therefore, you'll want to add more instances to your service, distributed more equally throughout the cluster to increase its redundancy.
- Your service is experiencing a low demand from your users, which means you might be hosting and maintaining more instances of your service than what is needed to fulfill the demand. Therefore, you'll want to decrease the number of active service instances to reduce your maintenance efforts and compute costs.
In this tutorial, you will learn how to horizontally scale in/out an existing Docker service, and you'll also experiment with scalability constraints and auto scaling solutions. For future reference, when we talk about Scaling In and Scaling Out, we mean the following:
- Scaling In: removing instances from an existing service.
- Scaling Out: adding more instances in parallel to spread out the service load.
Prerequisites
Before proceeding with this article, ensure that you've read and performed all the steps from the previous tutorial on Setting up Docker Swarm High Availability in Production. This means you should have four replicas of an NGINX service running on a 5-node cluster with three managers and two workers where all managers have been drained:
docker node ls
ID                            HOSTNAME    STATUS    AVAILABILITY   MANAGER STATUS   ENGINE VERSION
9r83zto8qpqiazt6slxfkjypq     manager-1   Ready     Drain          Reachable        20.10.18
uspt9qwqnzqwl78gbxc7omja7 *   manager-2   Ready     Drain          Leader           20.10.18
txrdxwuwjpg5jjfer3bcmtc5r     manager-3   Ready     Drain          Reachable        20.10.18
kaq8r9gec4t58yc9oh3dc0r2d     worker-1    Ready     Active                          20.10.18
vk1224zd81xcihgm1iis2703z     worker-2    Ready     Active                          20.10.18
We are currently working on the manager-2 node, which is the leader and is not schedulable (as it was drained in the previous tutorial). Go ahead and execute the following command to see the active services on the cluster:
docker service ls
ID             NAME          MODE         REPLICAS   IMAGE          PORTS
euqfhji2qpco   nginx_nginx   replicated   4/4        nginx:latest   *:8088->80/tcp
Currently, there is only one service with four replicas in the entire cluster. For now, ensure that you are connected to the Leader node (manager-2 in this example). If you do not have access to a Docker cluster as required to follow this tutorial, we recommend you use the online Docker playground.Getting started
In this tutorial, we'll mainly use the docker service management command to perform all the service inspections and scalability actions. Knowledge of this command is crucial when scaling your services since it allows you to perform the following actions through various subcommands:
inspectall the information about your service, including its previous and current states.list(orls) all the services running in your cluster.- list (
ps) all the tasks within a service. Each task will correspond to a replica of your service, so this information is critical when scaling in/out. updatea service's specification (i.e., its placement policies, number of replicas, etc.).rollbacka service to its previous specification.scaleone or more services concurrently, in, or out, which is pretty much the same as running a serviceupdateto change the number of service replicas.
To see these subcommands in action, let's take on a 5-step scenario where we'll analyze our current cluster and services, and then scale in and out a service while also applying scalability constraints.
Step 1 — Checking the current distribution of tasks
Docker services are composed of tasks which are scheduled into the cluster nodes based on the provided placement preferences and constraints. In the previous tutorial, our NGINX service was deployed via a Docker Stack, which was declared with the nginx.yaml compose file. Let's confirm this through the command below:
docker stack ls
You should observe just one stack which was deployed from our nginx.yaml compose file:
NAME      SERVICES   ORCHESTRATOR
nginx     1          Swarm
Next, list all the services in the nginx stack using the command below:
docker stack services nginx
ID             NAME          MODE         REPLICAS   IMAGE          PORTS
euqfhji2qpco   nginx_nginx   replicated   4/4        nginx:latest   *:8088->80/tcp
The above command produces all the services defined in the nginx.yaml file and deployed as part of the nginx stack above. In this case, it's the same as running docker service ls since there are no other stacks or services in the cluster.
It is easy to read through our nginx.yaml file to verify that we haven't defined any placement policies for this service. Take a look at the deploy section of the file:
version: '3.7'

networks:
  nginx:
    external: false

services:

  # --- NGINX ---
  nginx:
      image: nginx:latest
      ports:
        - '8088:80'
      healthcheck:
        test: ["CMD", "service", "nginx", "status"]
      networks:
        - nginx
We can also confirm this by using docker service inspect to get detailed information about the NGINX service. Because this inspection can return an exhaustive amount of information, we can format the output using a Go template. In our case, we know that the service's placement policies are detailed under the service's Spec->TaskTemplate->Placement field, so we can format our inspection output by running the following:
docker service inspect nginx_nginx --format '{{json .Spec.TaskTemplate.Placement}}'
{"Platforms":[{"Architecture":"amd64","OS":"linux"},{"OS":"linux"},{"OS":"linux"},{"Architecture":"arm64","OS":"linux"},{"Architecture":"386","OS":"linux"},{"Architecture":"mips64le","OS":"linux"},{"Architecture":"ppc64le","OS":"linux"},{"Architecture":"s390x","OS":"linux"}]}
As you can see, the service does not have any placement policies. We should expect that Docker is smart enough to distribute the four replicas of this service throughout all schedulable nodes of the cluster as evenly as possible. We have four schedulable nodes in our cluster, so in theory, we should have two NGINX replicas per worker node (since all three manager nodes are drained). Let's confirm this:
docker service ps nginx_nginx # list the tasks of the nginx_nginx service
ID             NAME                IMAGE          NODE        DESIRED STATE   CURRENT STATE           ERROR     PORTS
ikjo7su8ooo6   nginx_nginx.1       nginx:latest   worker-2    Running         Running 27 hours ago
inel921owq9b    \_ nginx_nginx.1   nginx:latest   manager-2   Shutdown        Shutdown 28 hours ago
y0y5mvj5n44r   nginx_nginx.2       nginx:latest   worker-1    Running         Running 27 hours ago
uk18jo6wwlq6    \_ nginx_nginx.2   nginx:latest   manager-3   Shutdown        Shutdown 28 hours ago
ijbalagf7isy   nginx_nginx.3       nginx:latest   worker-1    Running         Running 27 hours ago
drgu007baw8z   nginx_nginx.4       nginx:latest   worker-2    Running         Running 27 hours ago
As you can see, both worker nodes worker-1 and worker-2 are running two replicas of the NGINX service each. You can also see that the replicas that were running on manager-2 and manager-3 were shut down and reassigned to worker-2 and worker-1 respectively when both manager nodes were drained in step 8 of the previous tutorial.
Step 2 — Scaling out the service to 5 replicas
Let's begin this section by assuming our NGINX service is under a high load. We'll need to add another NGINX instance (aka replica) to cope with the increased demand. We can use the docker service scale command for this purpose. We only need to state the service name and the number of desired replicas.
docker service scale nginx_nginx=5
nginx_nginx scaled to 5
overall progress: 4 out of 5 tasks
1/5: running   [==================================================>]
2/5: starting  [============================================>      ]
3/5: running   [==================================================>]
4/5: running   [==================================================>]
5/5: running   [==================================================>]
Once the service is stable, we'll find a new replica in our service:
docker service ps nginx_nginx
ID             NAME                IMAGE          NODE        DESIRED STATE   CURRENT STATE            ERROR     PORTS
ikjo7su8ooo6   nginx_nginx.1       nginx:latest   worker-2    Running         Running 28 hours ago
inel921owq9b    \_ nginx_nginx.1   nginx:latest   manager-2   Shutdown        Shutdown 29 hours ago
y0y5mvj5n44r   nginx_nginx.2       nginx:latest   worker-1    Running         Running 28 hours ago
uk18jo6wwlq6    \_ nginx_nginx.2   nginx:latest   manager-3   Shutdown        Shutdown 29 hours ago
ijbalagf7isy   nginx_nginx.3       nginx:latest   worker-1    Running         Running 28 hours ago
drgu007baw8z   nginx_nginx.4       nginx:latest   worker-2    Running         Running 28 hours ago
This new nginx_nginx.5 task is now running alongside nginx_nginx.1 and nginx_nginx.4 in worker-2.
We could've also added a new NGINX replica by running:
docker service update nginx_nginx --replicas 5
The outcome would've been the same as:
docker service scale nginx_nginx=5
Nonetheless, we recommend always using the docker service scale command as it can scale multiple services simultaneously. For example:
docker service scale my_service=3 my_other_service=4 ...
On the other hand, docker service update can only update one service at a time.
Step 3 — Undoing a scaling operation
In this step, we will assume that we scaled our service by accident in the previous section and we'd like to revert our changes. As mentioned earlier, the docker service scale command is pretty much the same as a docker service update that only targets the number of service replicas. What happens under the hood is that the service is taking in a new specification where the number of replicas differs from the current one.
So how can we return our service to its previous state? Do we need to remember its entire previous specification by heart? Gladly we don't! Docker is smart enough to keep the service's previous specification within its definition. By running docker service inspect, we can examine a service's current and previous states:
docker service inspect nginx_nginx
[
    {
        "ID": "euqfhji2qpco",
        . . .
        . . .
    }
]
The above command results in a large output (thus truncated), but we can clearly see two top-level keys, Spec and PreviousSpec, which look identical at first, but if you look closely, PreviousSpec defines a Replicated service with 4 replicas, while Spec sets this number to 5 (as expected, given the scale out we've performed in the previous step).
Since we have this PreviousSpec information, we can determine what our service will look like once we revert to the previous state. But the question now is: how do we undo the last scaling operation?
Once again, Docker comes to the rescue! The docker service management command has a rollback subcommand for these situations. There's not much to know about it, you simply run docker service rollback on the desired service, and Docker will automatically update it to its PreviousSpec configuration. Go ahead and try it out as shown below:
docker service rollback nginx_nginx
nginx_nginx
rollback: manually requested rollback
overall progress: rolling back update: 4 out of 4 tasks
1/4: running   [>                                                  ]
2/4: running   [>                                                  ]
3/4: running   [>                                                  ]
4/4: running   [>                                                  ]
verify: Service converged
rollback: rollback completed
If the rollback is successful, we should now see our initial four replicas instead of the five we scaled out to in the previous step:
docker service ps nginx_nginx
ID             NAME                IMAGE          NODE        DESIRED STATE   CURRENT STATE           ERROR     PORTS
ikjo7su8ooo6   nginx_nginx.1       nginx:latest   worker-2    Running         Running 29 hours ago
inel921owq9b    \_ nginx_nginx.1   nginx:latest   manager-2   Shutdown        Shutdown 30 hours ago
y0y5mvj5n44r   nginx_nginx.2       nginx:latest   worker-1    Running         Running 29 hours ago
uk18jo6wwlq6    \_ nginx_nginx.2   nginx:latest   manager-3   Shutdown        Shutdown 30 hours ago
ijbalagf7isy   nginx_nginx.3       nginx:latest   worker-1    Running         Running 29 hours ago
drgu007baw8z   nginx_nginx.4       nginx:latest   worker-2    Running         Running 29 hours ago
And there we go, our service is back to where it was in Step 1, running with four replicas.
Step 4 — Scaling in the service to 3 replicas
Let's now assume we've been able to absorb the high service loads with our previous scale out and are now experiencing low demand for our service. To free up some space and potentially reduce our compute costs, let's shrink our service from four to three replicas:
docker service scale nginx_nginx=3
nginx_nginx scaled to 3
overall progress: 3 out of 3 tasks
1/3: running   [==================================================>]
2/3: running   [==================================================>]
3/3: running   [==================================================>]
verify: Service converged
The command is pretty much the same as in step 2, except for the desired number of replicas. Docker will take care of shutting down one of the replicas, leaving us with the desired number, evenly distributed throughout the cluster once again:
docker service ps nginx_nginx
ID             NAME                IMAGE          NODE        DESIRED STATE   CURRENT STATE           ERROR     PORTS
ikjo7su8ooo6   nginx_nginx.1       nginx:latest   worker-2    Running         Running 29 hours ago
inel921owq9b    \_ nginx_nginx.1   nginx:latest   manager-2   Shutdown        Shutdown 30 hours ago
y0y5mvj5n44r   nginx_nginx.2       nginx:latest   worker-1    Running         Running 29 hours ago
uk18jo6wwlq6    \_ nginx_nginx.2   nginx:latest   manager-3   Shutdown        Shutdown 30 hours ago
ijbalagf7isy   nginx_nginx.3       nginx:latest   worker-1    Running         Running 29 hours ago
Notice that other replicas weren't disturbed by this action — they are still running, uninterruptedly, for 29 hours.
Step 5 — Defining constraints while scaling a service
Finally, sometimes you might want to ensure that a certain condition is met, even after your service is already running. For example, let's assume we now need to scale out to five NGINX replicas again, but we discovered that our worker nodes are not capable of hosting more than two NGINX replicas concurrently without a performance degradation.
In such scenario, we can no longer use docker service scale because it does not allow us to specify other configurations besides the number of replicas. This is where the docker service update command comes in, as it offers a wide range of options for configuring the new state of our service.
We need a new number of replicas, plus one condition (no more than two replicas per node), so we can use the following options:
docker service update --help
. . .
--constraint-add list                Add or update a placement constraint
. . .
--replicas uint                      Number of tasks
--replicas-max-per-node uint         Maximum number of tasks per node (default 0 = unlimited)
. . .
Go ahead and run the following service update command to scale out to five replicas once more:
docker service update nginx_nginx --replicas 5 --replicas-max-per-node 2
nginx_nginx
overall progress: 2 out of 5 tasks
1/5: starting  [============================================>      ]
2/5: running   [==================================================>]
3/5: starting  [============================================>      ]
4/5: running   [==================================================>]
You'll observe that Docker will rightfully complain about your decision, because you've restricted each worker to only two replicas which means the fifth one will have no where to go. Since the above command was executed in the foreground, Docker will keep indefinitely, trying to fix this situation. You'll see something like this:
nginx_nginx
overall progress: 4 out of 5 tasks
1/5: running   [==================================================>]
2/5: running   [==================================================>]
3/5: running   [==================================================>]
4/5: running   [==================================================>]
5/5: no suitable node (max replicas per node limit exceed; scheduling constrain…
We can Ctrl+c to interrupt the process (the service update will continue in the background), and then verify that this new task is pending, waiting for a suitable node to show up:
docker service ps nginx_nginx --no-trunc # use --no-trunc to see the whole output
ID                          NAME                IMAGE                                                                                  NODE        DESIRED STATE   CURRENT STATE           ERROR                                                                                          PORTS
ikjo7su8ooo6b7wmh4r9uj1lq   nginx_nginx.1       nginx:latest@sha256:0b970013351304af46f322da1263516b188318682b2ab1091862497591189ff1   worker-2    Running         Running 3 days ago
inel921owq9bjq4zotkz590dz    \_ nginx_nginx.1   nginx:latest@sha256:0b970013351304af46f322da1263516b188318682b2ab1091862497591189ff1   manager-2   Shutdown        Shutdown 3 days ago
y0y5mvj5n44r23b5y548hrvsm   nginx_nginx.2       nginx:latest@sha256:0b970013351304af46f322da1263516b188318682b2ab1091862497591189ff1   worker-1    Running         Running 3 days ago
uk18jo6wwlq6qfrv2lr6zk1xz    \_ nginx_nginx.2   nginx:latest@sha256:0b970013351304af46f322da1263516b188318682b2ab1091862497591189ff1   manager-3   Shutdown        Shutdown 3 days ago
ijbalagf7isyu1drhm0hu8z95   nginx_nginx.3       nginx:latest@sha256:0b970013351304af46f322da1263516b188318682b2ab1091862497591189ff1   worker-1    Running         Running 3 days ago
lqa493b94iu8lpmc8yqtu4jd1   nginx_nginx.4       nginx:latest@sha256:0b970013351304af46f322da1263516b188318682b2ab1091862497591189ff1   worker-2    Running         Running 4 minutes ago
To move the highlighted Pending task above to Running, you can take either of the following actions:
- Redefine the scheduling constraints by allowing the cluster to run more than two replicas per node (as defined in the
docker service updatecommand above). - Horizontally scaling the cluster by provisioning additional worker nodes (this will be covered in the next tutorial).
Auto scaling Docker services (optional)
When talking about scaling container services, "auto scaling" often comes up. Now, the reason why this is a bonus (and optional) step, is because Docker doesn't really offer any auto scaling mechanisms (unlike Kubernetes).
Nonetheless, you might be wondering how to introduce some level of automation to help scale in and out Docker services. Let's face it, there is no right answer for this, nor there is any "one size fits all" solution that can help you. Because we cannot auto scale directly with Docker, we must resort to workarounds that might involve third-party tools, custom scripts, etc.
There are some tools out there (such as Orbiter) that are designed specifically to fill this gap in Docker. But depending on the use case and auto scaling rules, you could build a custom Docker auto scaler with just a few lines of Bash and a cronjob!
Our NGINX service from above currently has five replicas. Regardless of their state and placement policies, let's say we simply want to add and delete service replicas every time a worker joins or leaves the Docker Swarm cluster, such that we always have two replicas per worker.
Start by building a script to monitor the cluster size and scale the service when necessary. As a superuser, create a new file called "/opt/autoscaler.sh" and open it with your favorite text editor:
sudo nano /opt/autoscaler.sh
Paste the following text into the file:
#!/bin/sh

service_name=nginx_nginx

# 1
## let's see how many workers we have, by listing and counting all
## node IDs corresponding to the workers in the cluster
num_workers=$(docker node ls --filter role=worker -q | wc -l)

# 2
## then, let's infer the current number of replicas our service has
num_replicas=$(docker service inspect $service_name --format '{{json .Spec.Mode.Replicated.Replicas}}')

# 3
## let's then assess how many replicas we should have (2 per node)
let "target_replicas = 2*$num_workers"

# 4
## and finally, let's compare the target replicas
## with the ones we currently have, and if they are different
## we scale the service to the number of target_replicas
if [[ $num_replicas -ne $target_replicas ]]
then
  echo "Autoscaling Docker service ${service_name} to ${target_replicas} replicas"
  docker service scale $service_name=$target_replicas -d
fi

## else, there's nothing to do since we already have
## the desired amount of replicas
The above file defines a simplistic auto scaling rule, but applicable nonetheless. Next, you need to run this script periodically via a cronjob (say once every hour). To do that, execute the following command to open the crontab config file in your text editor:
crontab -e
Add the following line at the end of the file, then save and close it.
0 * * * * sh /opt/autoscaler.sh
With this setup in place, the /opt/autoscaler.sh script will be executed once per hour by the system's cron daemon. While this autoscaling infrastructure isn't production quality, it is enough to bootstrap your understanding of how to work around the autoscaling limitations in Docker.
Conclusion and next steps
In this tutorial, you learned about scaling a Docker Swarm service in and out, and how to undo a scaling operation. You also learned how to inspect a service so that you can make educated decisions about your scaling constraints. Finally, we touched base on auto scaling, giving you some tips on how to automate the scaling operations for your service.
In a future tutorial, we'll learn about horizontally scaling the cluster itself, such that a suitable node shows up to serve the pending task from step five.
This article was contributed by guest author Cristovao Cordeiro, a Docker certified Engineering Manager at Canonical. He's an expert in Containers and ex-CERN engineer with 9+ years of experience in Cloud and Edge computing.
Setting up Docker Swarm High Availability in Production
Link: https://betterstack.com/community/guides/scaling-docker/ha-docker-swarm/
Contents
Docker Swarm is a container orchestration tool that makes it easy to manage and scale your existing Docker infrastructure. It consists of a pool of Docker hosts that run in Swarm mode with some nodes acting as managers, workers, or both. Using Docker Swarm mode to manage your Docker containers brings the following benefits:
- It allows you to incrementally apply updates with zero downtime.
- It increases application resilience to outages by reconciling any differences between the actual state and your expressed desired state.
- It eases the process of scaling your applications since you only need to define the desired number of replicas in the cluster.
- It is built into the
dockerCLI, so you don't need additional software to get up and running. - It enables multi-host networking such that containers deployed on different nodes can communicate with each other easily.
In this tutorial, you will learn key concepts in Docker Swarm and set up a highly available Swarm cluster that is resilient to failures. You will also learn some best practices and recommendations to ensure that your Swarm setup is fault tolerant.
Prerequisites
Before proceeding with this tutorial, ensure that you have access to five Ubuntu 22.04 servers. This is necessary to demonstrate a highly available set up, although it is also possible to run Docker Swarm on a single machine. You also need to configure each server with a user that has administrative privileges.
The following ports must also be available on each server for communication purposes between the nodes. On Ubuntu 22.04, they are open by default:
- TCP port 2377 for cluster management communications,
- TCP and UDP port 7946 for communication among nodes,
- TCP and UDP port 4789 for overlay network traffic.
Explaining Docker Swarm terminology
Before proceeding with this tutorial, let's examine some terms and definitions in Docker Swarm so that you have enough understanding of what each one means when they are used in this article and in other Docker Swarm resources.
- Node: refers to an instance of the Docker engine in the Swarm cluster.
- Manager nodes: they are tasked with handling orchestration and cluster management functions, and dispatching incoming tasks to worker nodes. They can also act as worker nodes unless placed in Drain mode (recommended).
- Leader: this is a specific manager node that is elected to perform orchestration tasks and management/maintenance operations by all the manager nodes in the cluster using the Raft Consensus Algorithm.
- Worker nodes: are Docker instances whose sole purpose is to receive and execute Swarm tasks from manager nodes.
- Swarm task: refers to a Docker container and the commands that run inside the container. Once a task is assigned to a node, it can run or fail but it cannot be transferred to a different node.
- Swarm service: this is the mechanism for defining tasks that should be executed on a node. It involves specifying the container image and commands that should run inside the container.
- Drain: means that new tasks are no longer assigned to a node, and existing tasks are reassigned to other available nodes.
Docker Swarm requirements for high availability
A highly available Docker Swarm setup ensures that if a node fails, services on the failed node are re-provisioned and assigned to other available nodes in the cluster. A Docker Swarm setup that consists of one or two manager nodes is not considered highly available because any incident will cause operations on the cluster to be interrupted. Therefore the minimum number of manager nodes in a highly available Swarm cluster should be three.
The table below shows the number of failures a Swarm cluster can tolerate depending on the number of manager nodes in the cluster:
| Manager Nodes | Failures tolerated |
|---|---|
| 1 | 0 |
| 2 | 0 |
| 3 | 1 |
| 4 | 1 |
| 5 | 2 |
| 6 | 2 |
| 7 | 3 |
As you can see, having an even number of manager nodes does not help with failure tolerance, so you should always maintain an odd number of manager nodes. Fault tolerance improves as you add more manager nodes, but Docker recommends no more than seven managers so that performance is not negatively impacted since each node must acknowledge proposals to update the state of the cluster.
You should also distribute your manager nodes in separate locations so they are not affected by the same outage. If they run on the same server, a hardware problem could cause them all to go down. The high availability Swarm cluster that you will be set up in this tutorial will therefore exhibit the following characteristics:
- 5 total nodes (2 workers and 3 managers) with each one running on a separate server.
- 2 worker nodes (
worker-1andworker-2). - 3 manager nodes (
manager-1,manager-2, andmanager-3).
Step 1 — Installing Docker
In this step, you will install Docker on all five Ubuntu servers. Therefore, execute all the commands below (and in step 2) on all five servers. If your host offers a snapshot feature, you may be able to run the commands on a single server and use that server as a base for the other four instances.
Let's start by installing the latest version of the Docker Engine (20.10.18 at the time of writing). Go ahead and update the package information list from all configured sources on your system:
sudo apt update
Afterward, install the following packages to allow apt use packages over HTTPS:
sudo apt install apt-transport-https ca-certificates curl software-properties-common
Next, add the GPG key for the official Docker repository to the server:
curl -fsSL https://download.docker.com/linux/ubuntu/gpg | sudo gpg --dearmor -o /usr/share/keyrings/docker-archive-keyring.gpg
Once the GPG key is added, include the official Docker repository in the server's apt sources list.
echo "deb [arch=amd64 signed-by=/usr/share/keyrings/docker-archive-keyring.gpg] https://download.docker.com/linux/ubuntu $(lsb_release -cs) stable" | sudo tee /etc/apt/sources.list.d/docker.list > /dev/null
Finally, update apt once again and install the Docker Engine:
sudo apt update
sudo apt install docker-ce
Once the relevant packages are installed, you check the status of the docker service using the command below:
sudo systemctl status docker
If everything goes well, you should observe that the container engine is active and running on your server:
● docker.service - Docker Application Container Engine
     Loaded: loaded (/lib/systemd/system/docker.service; enabled; vendor preset: enabled)
     Active: active (running) since Wed 2022-09-21 10:18:15 UTC; 58s ago
TriggeredBy: ● docker.socket
       Docs: https://docs.docker.com
   Main PID: 25355 (dockerd)
      Tasks: 7
     Memory: 22.2M
        CPU: 346ms
     CGroup: /system.slice/docker.service
             └─25355 /usr/bin/dockerd -H fd:// --containerd=/run/containerd/containerd.sock
In the next step, we will add the current user to the docker group so that you can use the docker command without escalating to administrative privileges (using sudo) which can lead to security issues.
Step 2 — Executing the Docker command without sudo
By default, the docker command can only be executed by the root user or any user in the docker group (auto created on installation). If you execute a docker command without prefixing it with sudo or running it through a user that belongs to the docker group, you will get a permission error that looks like this:
Got permission denied while trying to connect to the Docker daemon socket at unix:///var/run/docker.sock: Get "http://%2Fvar%2Frun%2Fdocker.sock/v1.24/containers/json": dial unix /var/run/docker.sock: connect: permission denied
As mentioned earlier, using sudo with docker is a security risk, so the solution to the above error is to add the relevant user to the docker group which can be achieved through the command below:
sudo usermod -aG docker ${USER}
Next, run the following command and enter the user's password when prompted for the changes to take effect:
su - ${USER}
You should now be able to run docker commands without prefixing them with sudo. For example, when you run the command below:
docker ps
You should observe the following output:
CONTAINER ID IMAGE COMMAND CREATED STATUS PORTS NAMES
Before proceeding to the next step, ensure that all the commands in step 1 and step 2 have been executed on all five servers.
Step 3 — Initializing the Swarm Cluster
At this point, each of your five Docker instances are acting as separate hosts and not as part of a Swarm cluster. Therefore, in this step, we will initialize the Swarm cluster on the manager-1 server and add the hosts to the cluster accordingly.
Start by logging into one of the Ubuntu servers (manager-1), and retrieve the private IP address of the machine using the following command:
hostname -I | awk '{print $1}'
<manager_1_server_ip>
Copy the IP address to your clipboard and replace the <manager_1_server_ip> placeholder in the command below to initialize Swarm mode:
docker swarm init --advertise-addr <manager_1_server_ip>
Swarm initialized: current node (9r83zto8qpqiazt6slxfkjypq) is now a manager.

To add a worker to this swarm, run the following command:
To add a manager to this swarm, run 'docker swarm join-token manager' and follow the instructions.
The command above enables Swarm mode on the node and configures it as the first manager of the cluster. Ensure to copy the entire command to your clipboard (and replace the placeholders) as it will be utilized in the next section.
You can view the current state of the Swarm using the command below:
docker info
. . .
 Swarm: active
  NodeID: 9r83zto8qpqiazt6slxfkjypq
  Is Manager: true
  ClusterID: q6laywz9u8xlis9wlkbzap8i0
  Managers: 1
  Nodes: 1
. . .
You can also use the command below to view information regarding the nodes on the cluster:
docker node ls
ID                            HOSTNAME    STATUS    AVAILABILITY   MANAGER STATUS   ENGINE VERSION
9r83zto8qpqiazt6slxfkjypq *   manager-1   Ready     Active         Leader           20.10.18
The * next to the node ID indicates that you're currently connected to this node. Here's the meaning of the other values:
- Ready: the node is recognized by the manager and can participate in the cluster.
- Active: the node is used as a worker also to run Docker containers.
- Leader: the node is a manager node and is also the cluster's leader.
In the next section of this tutorial, we will add two workers to our cluster bringing the total nodes to three.
Step 4 — Adding worker nodes to the cluster
Adding worker modes to a cluster can be done by running the command copied from step 3 above (the docker swarm init output) on the worker-1 and worker-2 servers:
docker swarm join --token <token> <manager_1_server_ip>:<port>
This node joined a swarm as a worker.
If you forgot to copy the join command for workers, use the command below on the manager-1 server to retrieve it:
docker swarm join-token worker
To add a worker to this swarm, run the following command:
After executing the join command on each worker node, you should be able to see the updated list of Swarm nodes when you run the command below on your manager-1 server:
docker node ls
ID                            HOSTNAME    STATUS    AVAILABILITY   MANAGER STATUS   ENGINE VERSION
9r83zto8qpqiazt6slxfkjypq *   manager-1   Ready     Active         Leader           20.10.18
kaq8r9gec4t58yc9oh3dc0r2d     worker-1    Ready     Active                          20.10.18
vk1224zd81xcihgm1iis2703z     worker-2    Ready     Active                          20.10.18
The empty MANAGER column for the worker-1 and worker-2 nodes identifies them as worker nodes. Note that you can promote a worker node to a manager mode by using the command below:
docker node promote <worker_node_id>
Node <worker_node_id> promoted to a manager in the swarm.
Step 5 — Adding manager nodes to the cluster
In this section, you will add the remaining two nodes to the cluster as managers. This time, you need to retrieve the join command for manager nodes by running the command below on the manager-1 server:
docker swarm join-token manager
Output:
To add a manager to this swarm, run the following command:

    docker swarm join --token <token> <manager_1_server_ip>:<port>
Copy the generated command above and execute it on each additional manager nodes (manager-2 and manager-3) as shown below:
docker swarm join --token <token> <manager_1_server_ip>:<port>
This node joined a swarm as a manager.
Finally, verify the status of the cluster nodes using the following command:
docker node ls
ID                            HOSTNAME    STATUS    AVAILABILITY   MANAGER STATUS   ENGINE VERSION
9r83zto8qpqiazt6slxfkjypq *   manager-1   Ready     Active         Leader           20.10.18
uspt9qwqnzqwl78gbxc7omja7     manager-2   Ready     Active         Reachable        20.10.18
txrdxwuwjpg5jjfer3bcmtc5r     manager-3   Ready     Active         Reachable        20.10.18
kaq8r9gec4t58yc9oh3dc0r2d     worker-1    Ready     Active                          20.10.18
vk1224zd81xcihgm1iis2703z     worker-2    Ready     Active                          20.10.18
Note that you can also demote a manager node to a worker as follows:
docker node demote <manager_node_id>
Manager <manager_node_id> demoted in the swarm.
Step 6 — Draining a node on the swarm
At the moment, all five nodes in the swarm cluster are running with Active availability. This means they are all available to accept new tasks from the swarm manager (including the leader). If you want to avoid scheduling tasks on a node, you need to drain it such that no new tasks are assigned to it, and existing tasks are stopped and relaunched on a replica node with Active availability.
In this section, you will drain the manager node so that it is no longer able to receive new tasks, which should help to improve its performance since no resources will be allocated towards running Docker containers.
Before you can drain a node, you need to figure out ID of the node to be drained using the following command on the manager-1 server:
docker node ls
Copy the ID of the Leader node:
ID                            HOSTNAME    STATUS    AVAILABILITY   MANAGER STATUS   ENGINE VERSION
9r83zto8qpqiazt6slxfkjypq *   manager-1   Ready     Active         Leader           20.10.18
. . .
Next, update the node availability using the below command:
docker node update --availability drain <leader_node_id>
<leader_node_id>
When you run docker node ls once more, you should observe that the AVAILABILITY of the Leader node has been changed to Drain:
docker node ls
Output:
ID                            HOSTNAME    STATUS    AVAILABILITY   MANAGER STATUS   ENGINE VERSION
9r83zto8qpqiazt6slxfkjypq *   manager-1   Ready     Drain          Leader           20.10.18
uspt9qwqnzqwl78gbxc7omja7     manager-2   Ready     Active         Reachable        20.10.18
txrdxwuwjpg5jjfer3bcmtc5r     manager-3   Ready     Active         Reachable        20.10.18
kaq8r9gec4t58yc9oh3dc0r2d     worker-1    Ready     Active                          20.10.18
vk1224zd81xcihgm1iis2703z     worker-2    Ready     Active                          20.10.18
You can also use the docker node inspect command to check the availability of a node:
docker node inspect --pretty <node_id>
ID:                     <node_id>
Hostname:               manager-1
Joined at:              2022-09-21 11:07:08.730840341 +0000 utc
Status:
 State:                 Ready
 Address:               116.203.21.130
Manager Status:
 Address:               <ip_address>
 Raft Status:           Reachable
 Leader:                Yes

. . .
If you change your mind about draining a node, you can return it to an active state by executing the following command:
docker node update --availability active <node_id>
Step 7 — Deploying a Highly Available NGINX service
In this section, you will deploy a service to the running cluster using a High Availability Swarm configuration. We'll be utilizing the official NGINX docker image for demonstration purposes, but you can use any Docker image you want.
Start by creating the compose file for the nginx service on the manager-1 server with all the necessary configurations for High Availability mode.
nano nginx.yaml
version: '3.7'

networks:
  nginx:
    external: false

services:

  # --- NGINX ---
  nginx:
      image: nginx:latest
      ports:
        - '8088:80'
      deploy:
        replicas: 4
        update_config:
          parallelism: 2
          order: start-first
          failure_action: rollback
          delay: 10s
        rollback_config:
          parallelism: 0
          order: stop-first
        restart_policy:
          condition: any
          delay: 5s
          max_attempts: 3
          window: 120s
      healthcheck:
        test: ["CMD", "service", "nginx", "status"]
      networks:
        - nginx
The above file configures an nginx service with four replicas. Updates to the containers will be carried out in batches (two at a time) with a wait time of 10 seconds before updating the next batch. If an update failure is detected, it will roll back to the previous configuration. Please see the Compose file reference for more information.
Go ahead and deploy the NGINX stack on the manager-1 node using the command below:
docker stack deploy -c nginx.yaml nginx
Creating network nginx_nginx
Creating service nginx_nginx
Once you deploy the stack, you will be able to see a list of running services on the cluster using the command below:
docker service ls
ID             NAME          MODE         REPLICAS   IMAGE          PORTS
xh24wj31z4ml   nginx_nginx   replicated   4/4        nginx:latest   *:8088->80/tcp
You can also see which nodes are running the service:
docker service ps <service_id>
ID             NAME            IMAGE          NODE        DESIRED STATE   CURRENT STATE           ERROR     PORTS
inel921owq9b   nginx_nginx.1   nginx:latest   manager-2   Running         Running 2 minutes ago
uk18jo6wwlq6   nginx_nginx.2   nginx:latest   manager-3   Running         Running 2 minutes ago
ijbalagf7isy   nginx_nginx.3   nginx:latest   worker-1    Running         Running 2 minutes ago
drgu007baw8z   nginx_nginx.4   nginx:latest   worker-2    Running         Running 2 minutes ago
Each replica runs on the four Active nodes in this case. The DESIRED STATE and CURRENT STATE columns lets you determine the tasks are running according to the service definition.
If you want to see details about the container for a task, run docker ps on the relevant node. For example, on manager-3:
docker ps
CONTAINER ID   IMAGE          COMMAND                  CREATED         STATUS                   PORTS     NAMES
62e396145307   nginx:latest   "/docker-entrypoint.…"   7 minutes ago   Up 7 minutes (healthy)   80/tcp    nginx_nginx.2.uk18jo6wwlq6qfrv2lr6zk1xz
Monitor your Docker Swarm cluster with Better Stack
While Docker Swarm handles container orchestration, Better Stack provides comprehensive monitoring for your distributed services. Track container health, collect logs from all nodes, and get alerted when services fail with infrastructure monitoring that checks your cluster every 30 seconds.
Predictable pricing and up to 30x cheaper than Datadog. Start free in minutes.
Step 8 — Draining the other manager nodes
As mentioned earlier, manager nodes should ideally be only responsible for management-related tasks. Currently, two of the three manager nodes are running replicas of the NGINX service which could hamper management operations under certain conditions. To prevent such interference, it is best to mark them as unavailable for running tasks by draining them as follows:
docker node update --availability drain <manager_node_id>
Once you've done so for both the manager-2 and manager-3 nodes, you'll observe that their AVAILABILITY has been updated to drain:
docker node ls
ID                            HOSTNAME    STATUS    AVAILABILITY   MANAGER STATUS   ENGINE VERSION
9r83zto8qpqiazt6slxfkjypq *   manager-1   Ready     Drain          Leader           20.10.18
uspt9qwqnzqwl78gbxc7omja7     manager-2   Ready     Drain          Reachable        20.10.18
txrdxwuwjpg5jjfer3bcmtc5r     manager-3   Ready     Drain          Reachable        20.10.18
kaq8r9gec4t58yc9oh3dc0r2d     worker-1    Ready     Active                          20.10.18
vk1224zd81xcihgm1iis2703z     worker-2    Ready     Active                          20.10.18
The NGINX replicas that were running on both manager nodes are subsequently stopped and reassigned to each worker node. You can confirm that four replicas are still running using the command below:
docker service ls
ID             NAME          MODE         REPLICAS   IMAGE          PORTS
xh24wj31z4ml   nginx_nginx   replicated   4/4        nginx:latest   *:8088->80/tcp
Now, confirm which nodes are running each replica through the command below:
docker service ps <service_id>
ID             NAME                IMAGE          NODE        DESIRED STATE   CURRENT STATE               ERROR     PORTS
ikjo7su8ooo6   nginx_nginx.1       nginx:latest   worker-2    Running         Running 19 minutes ago
inel921owq9b    \_ nginx_nginx.1   nginx:latest   manager-2   Shutdown        Shutdown 19 minutes ago
y0y5mvj5n44r   nginx_nginx.2       nginx:latest   worker-1    Running         Running 19 minutes ago
uk18jo6wwlq6    \_ nginx_nginx.2   nginx:latest   manager-3   Shutdown        Shutdown 19 minutes ago
ijbalagf7isy   nginx_nginx.3       nginx:latest   worker-1    Running         Running about an hour ago
drgu007baw8z   nginx_nginx.4       nginx:latest   worker-2    Running         Running about an hour ago
As you can see, the manager-2 and manager-3 tasks were shut down 19 minutes ago and subsequently reassigned to worker-2 and worker-1 respectively. Your manager nodes are now only responsible for cluster management activities and maintaining high availability of the cluster.
Step 9 — Testing the failover mechanism
Before concluding this tutorial, let's test the availability of our cluster by causing the current leader (manager-1) to fail. Once this happens, the other managers should detect the failure and elect a new leader.
You can cause the manager-1 node to become unavailable by stopping the docker service on the server:
sudo systemctl stop docker
Afterward, run the docker node ls command on any of the other manager nodes:
docker node ls
ID                            HOSTNAME    STATUS    AVAILABILITY   MANAGER STATUS   ENGINE VERSION
9r83zto8qpqiazt6slxfkjypq     manager-1   Ready     Drain          Unreachable      20.10.18
uspt9qwqnzqwl78gbxc7omja7     manager-2   Ready     Drain          Leader           20.10.18
txrdxwuwjpg5jjfer3bcmtc5r *   manager-3   Ready     Drain          Reachable        20.10.18
kaq8r9gec4t58yc9oh3dc0r2d     worker-1    Ready     Active                          20.10.18
vk1224zd81xcihgm1iis2703z     worker-2    Ready     Active                          20.10.18
Notice that manager-1 is deemed unreachable and manager-2 has been elected the new leader. If you check the NGINX service status, you'll observe that the replicas running on the worker nodes were all restarted afterward:
docker service ps <service_id>
ID             NAME                IMAGE          NODE        DESIRED STATE   CURRENT STATE             ERROR     PORTS
ikjo7su8ooo6   nginx_nginx.1       nginx:latest   worker-2    Running         Running 3 minutes ago
inel921owq9b    \_ nginx_nginx.1   nginx:latest   manager-2   Shutdown        Shutdown 34 minutes ago
y0y5mvj5n44r   nginx_nginx.2       nginx:latest   worker-1    Running         Running 3 minutes ago
uk18jo6wwlq6    \_ nginx_nginx.2   nginx:latest   manager-3   Shutdown        Shutdown 34 minutes ago
ijbalagf7isy   nginx_nginx.3       nginx:latest   worker-1    Running         Running 3 minutes ago
drgu007baw8z   nginx_nginx.4       nginx:latest   worker-2    Running         Running 3 minutes ago
When you start the docker service on manager-1 once again, it will be marked as Reachable, but manager-2 will remain the Leader of the cluster.
sudo systemctl start docker
docker node ls
ID                            HOSTNAME    STATUS    AVAILABILITY   MANAGER STATUS   ENGINE VERSION
9r83zto8qpqiazt6slxfkjypq *   manager-1   Ready     Drain          Reachable        20.10.18
uspt9qwqnzqwl78gbxc7omja7     manager-2   Ready     Drain          Leader           20.10.18
txrdxwuwjpg5jjfer3bcmtc5r     manager-3   Ready     Drain          Reachable        20.10.18
kaq8r9gec4t58yc9oh3dc0r2d     worker-1    Ready     Active                          20.10.18
vk1224zd81xcihgm1iis2703z     worker-2    Ready     Active                          20.10.18
Monitoring your Docker Swarm cluster
You've set up a highly available Docker Swarm cluster that can withstand node failures and automatically redistribute workloads. However, high availability means nothing without proper monitoring to detect issues before they impact your services.
Better Stack provides unified monitoring for your entire Swarm cluster:
- Infrastructure monitoring checks all your nodes every 30 seconds from global locations
- Collect logs from all containers across manager and worker nodes in one place
- Track container health, resource usage, and service availability
- Get instant alerts via email, SMS, or phone when nodes become unreachable
- Monitor NGINX and other services with automatic health checks
- Create status pages to communicate cluster status to users
- Incident management tools coordinate your team during outages
Instead of manually checking docker service ps and docker node ls, Better Stack gives you real-time visibility into your entire cluster. When a manager node fails like in Step 9, you'll get alerted immediately rather than discovering it later.
The platform combines infrastructure monitoring, log management, and incident response in one place, eliminating the need to piece together multiple monitoring tools for your Swarm cluster.
If you want comprehensive monitoring for your Docker Swarm setup, check out Better Stack.
Final thoughts
A highly available setup is one of the essential requirements for any production system, but building such systems used to be a tedious and complex task. As demonstrated in this tutorial, using Docker and Docker Swarm makes this task much easier and also takes fewer resources when compared to other technologies (such as Kubernetes) used to accomplish the same type of high availability setup.
There's a lot more pertaining to Docker Swarm (security, scaling, secrets management, etc) that cannot be covered in one tutorial, so ensure to check out the official Swarm guide and the rest of our scaling docker tutorial series. If you would like to read more on Docker, feel free to also explore our Docker logging guide.
Thanks for reading!
Swarmpit Docker
Link: https://github.com/swarmpit/swarmpit#installation https://swarmpit.io/
![]()
Lightweight mobile-friendly Docker Swarm management UI
⚠️ Status: This UI is in maintenance mode. Click here for details.


![]()

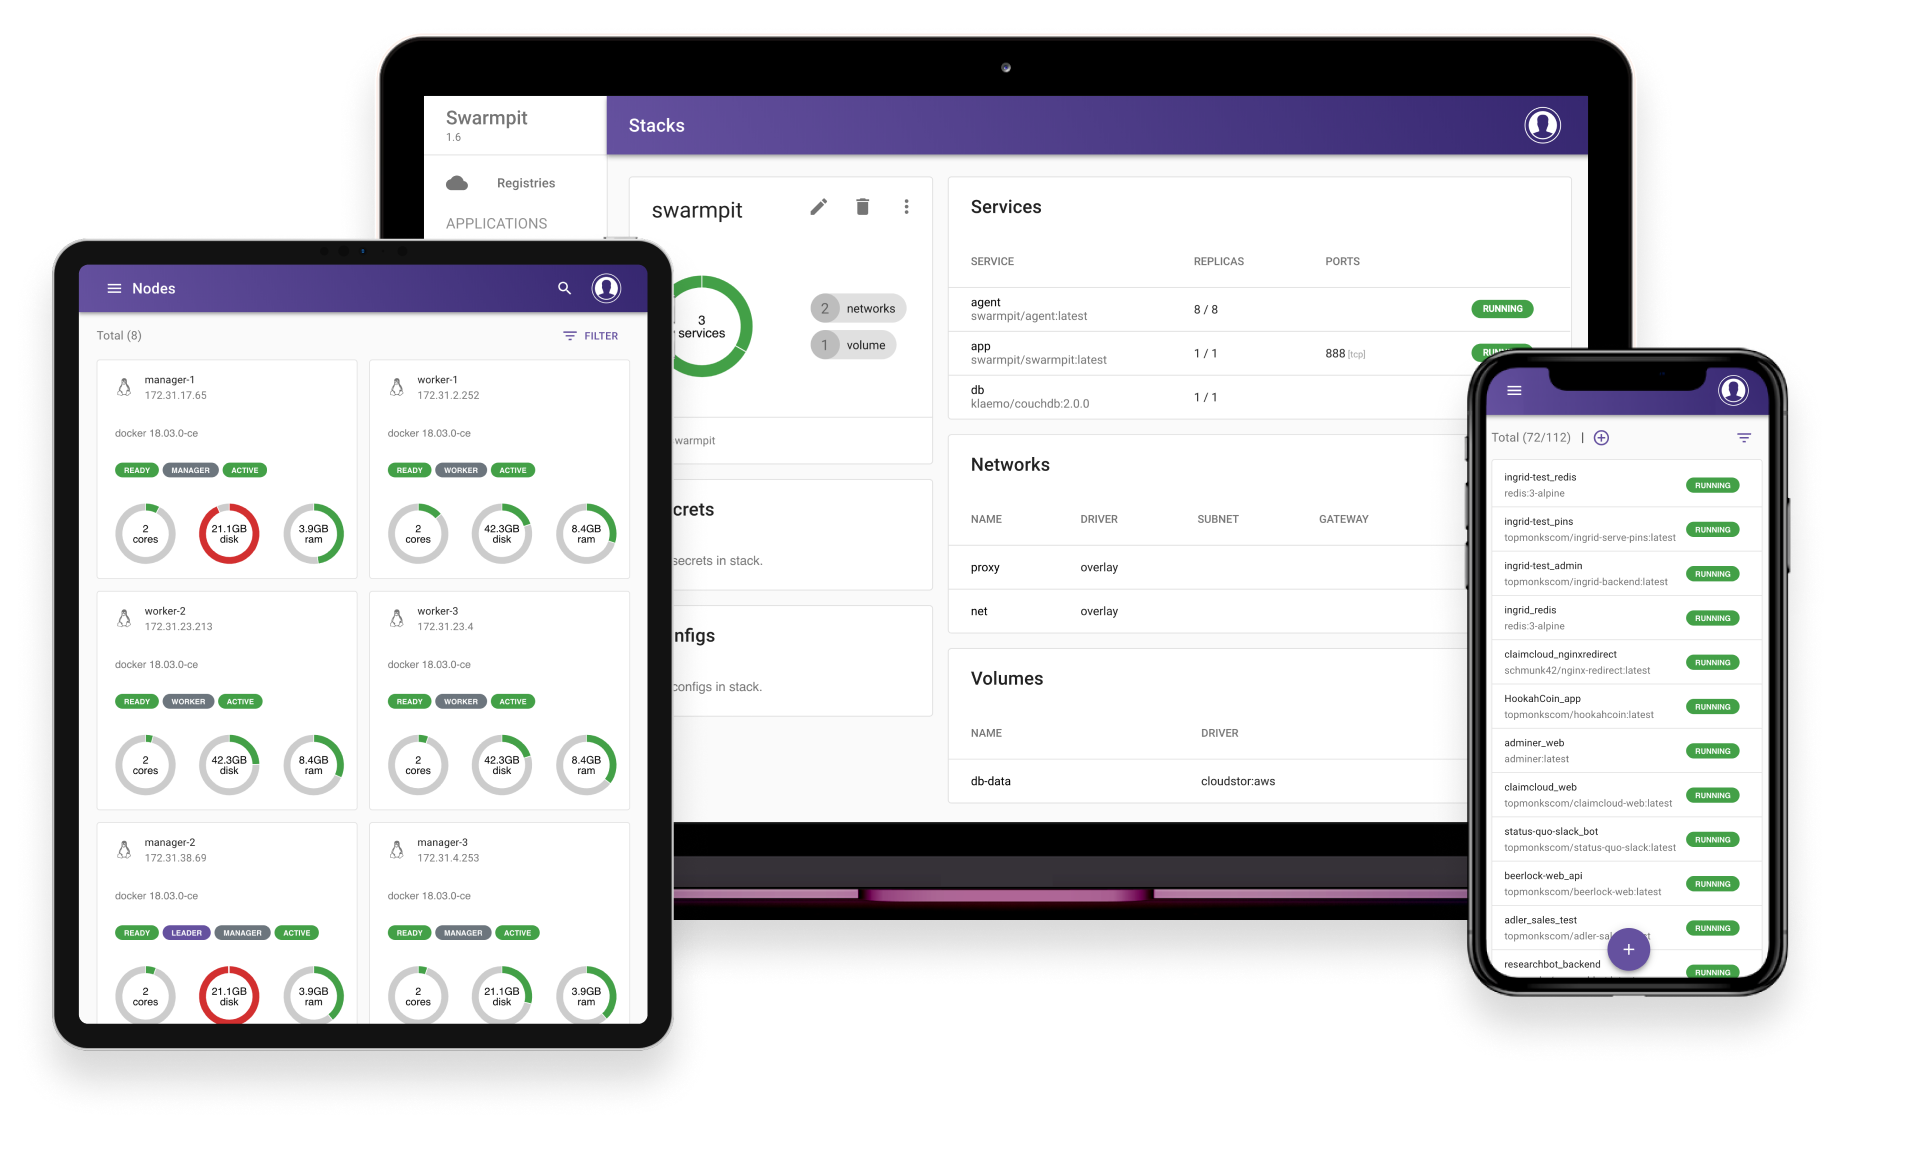
Swarmpit provides simple and easy to use interface for your Docker Swarm cluster. You can manage your stacks, services, secrets, volumes, networks etc. After linking your Docker Hub account or custom registry, private repositories can be easily deployed on Swarm. Best of all, you can share this management console securely with your whole team.
Swarmpit doesn't compromise your privacy as it is completely self-hosted and will never gather any metrics or other data from you.
More details about future and past releases can be found in ROADMAP.md

Installation
The only dependency for Swarmpit deployment is Docker with Swarm initialized, we are supporting Docker 1.13 and newer. Linux hosts on x86 and ARM architectures are supported as well.
Package installer
Installer is your guide to setup Swarmpit platform. For more details see the installer
Stable version
Deploy our current milestone version
docker run -it --rm \
  --name swarmpit-installer \
  --volume /var/run/docker.sock:/var/run/docker.sock \
  swarmpit/install:1.9
Edge version
Deploy latest version for the brave and true
docker run -it --rm \
  --name swarmpit-installer \
  --volume /var/run/docker.sock:/var/run/docker.sock \
  swarmpit/install:edge
Manual installation
Deploy Swarmpit by using a compose file from our git repo with branch of corresponding version.
git clone https://github.com/swarmpit/swarmpit -b master
docker stack deploy -c swarmpit/docker-compose.yml swarmpit
For ARM based cluster use custom compose file.
git clone https://github.com/swarmpit/swarmpit -b master
docker stack deploy -c swarmpit/docker-compose.arm.yml swarmpit
This stack is a composition of 4 services:
- app - Swarmpit
- agent - Swarmpit agent
- db - CouchDB (Application data)
- influxdb - InfluxDB (Cluster statistics)
Feel free to edit the stackfile to change an application port and we strongly recommend to specify following volumes:
- db-data
- influxdb-data
Swarmpit is published on port 888 by default.
Environment Variables
Refer to following document
User Configuration
By default Swarmpit offers you to configure first user using web interface. If you want to automate this process, you can use docker config to provide users.yaml file.
Refer to following document for details.
User Types
Refer to following document
Development
Swarmpit is written purely in Clojure and utilizes React on front-end. CouchDB is used to persist application data & InfluxDB for cluster statistics.
Everything about building, issue reporting and setting up development environment can be found in CONTRIBUTING.md
Demo

Deploys Swarmpit to play-with-docker sandbox. Please wait few moments till application is up and running before accessing port 888. Initialization might take a few seconds.